
Figure 6. Antigen-binding-induced BCR down-modulation.
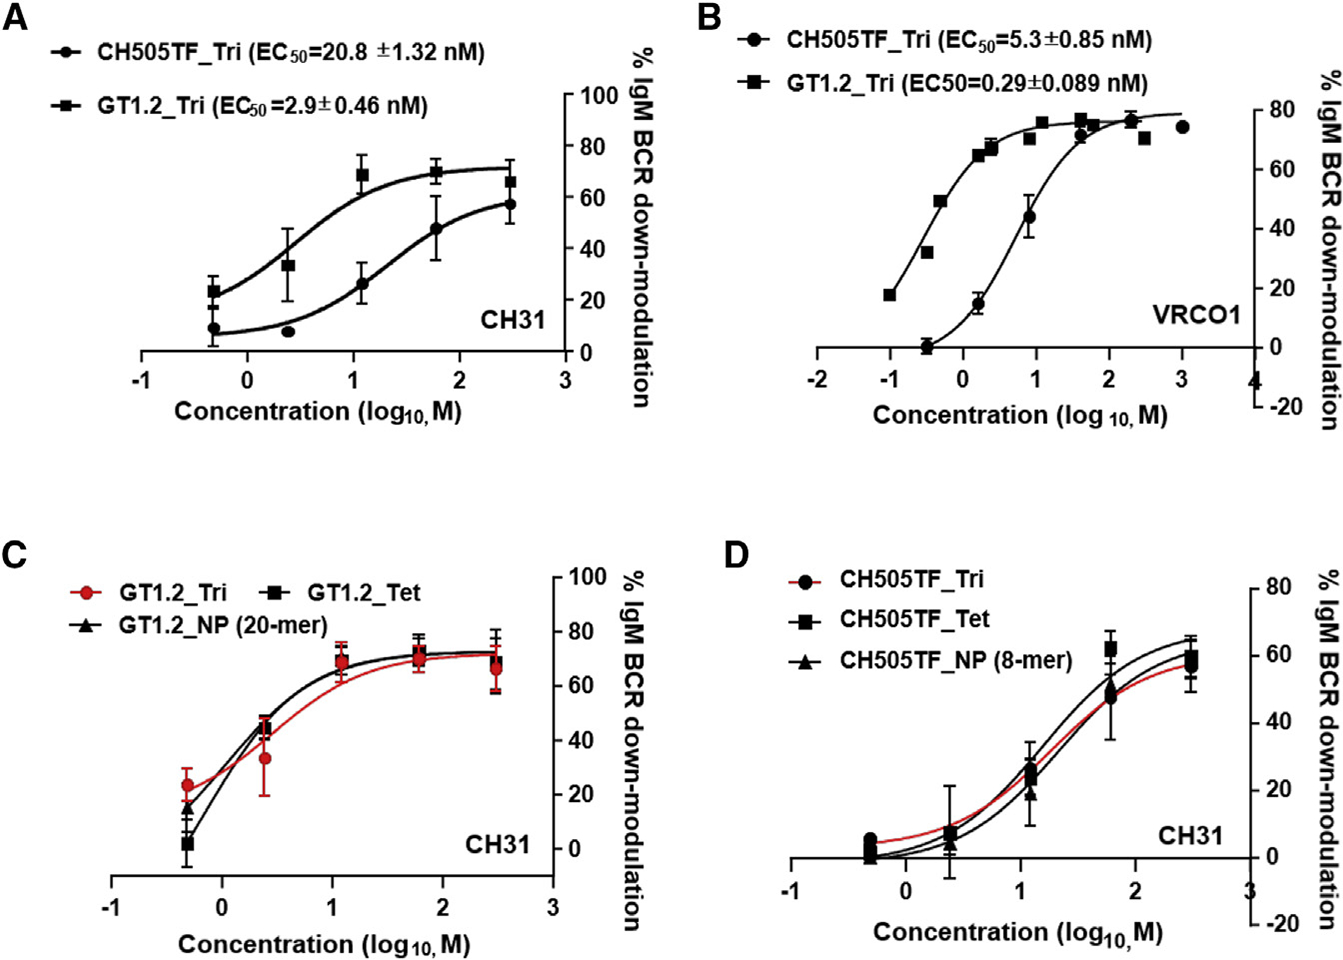
(A–D) Dose-response curves of CH505TF or GT1.2 trimer-induced %IgM BCR down-modulation following exposure of each protein to (A) CH31-IgM or (B) VRC01-IgM Ramos cells. Cells were stimulated with either Env trimers (CH505TF and GT1.2) over a concentration range of 0.48 to 300 nM or PBS for 1 h at 37°C and subsequently stained for surface IgM BCRs and analyzed by flow cytometry. Percentage of IgM BCR down-modulation for each concentration was obtained by the MFI of the sample and PBS-treated control. (C and D) Dose-dependent %IgM BCR down-modulation of CH31 IgM BCRs following exposure to GT1.2 (C) or CH505TF (D), each protein in either trimer (circle), tetramer of trimers (rectangle), or higher-order multimeric nanoparticle (NP) forms (triangle, GT1.2 20-mer or CH505TF 8-mer). The data show mean %IgM BCR down-modulation with standard deviation calculated from three independent experiments.