
Figure 7. Dissociation of surface bound antigen and BCR-antigen internalization.
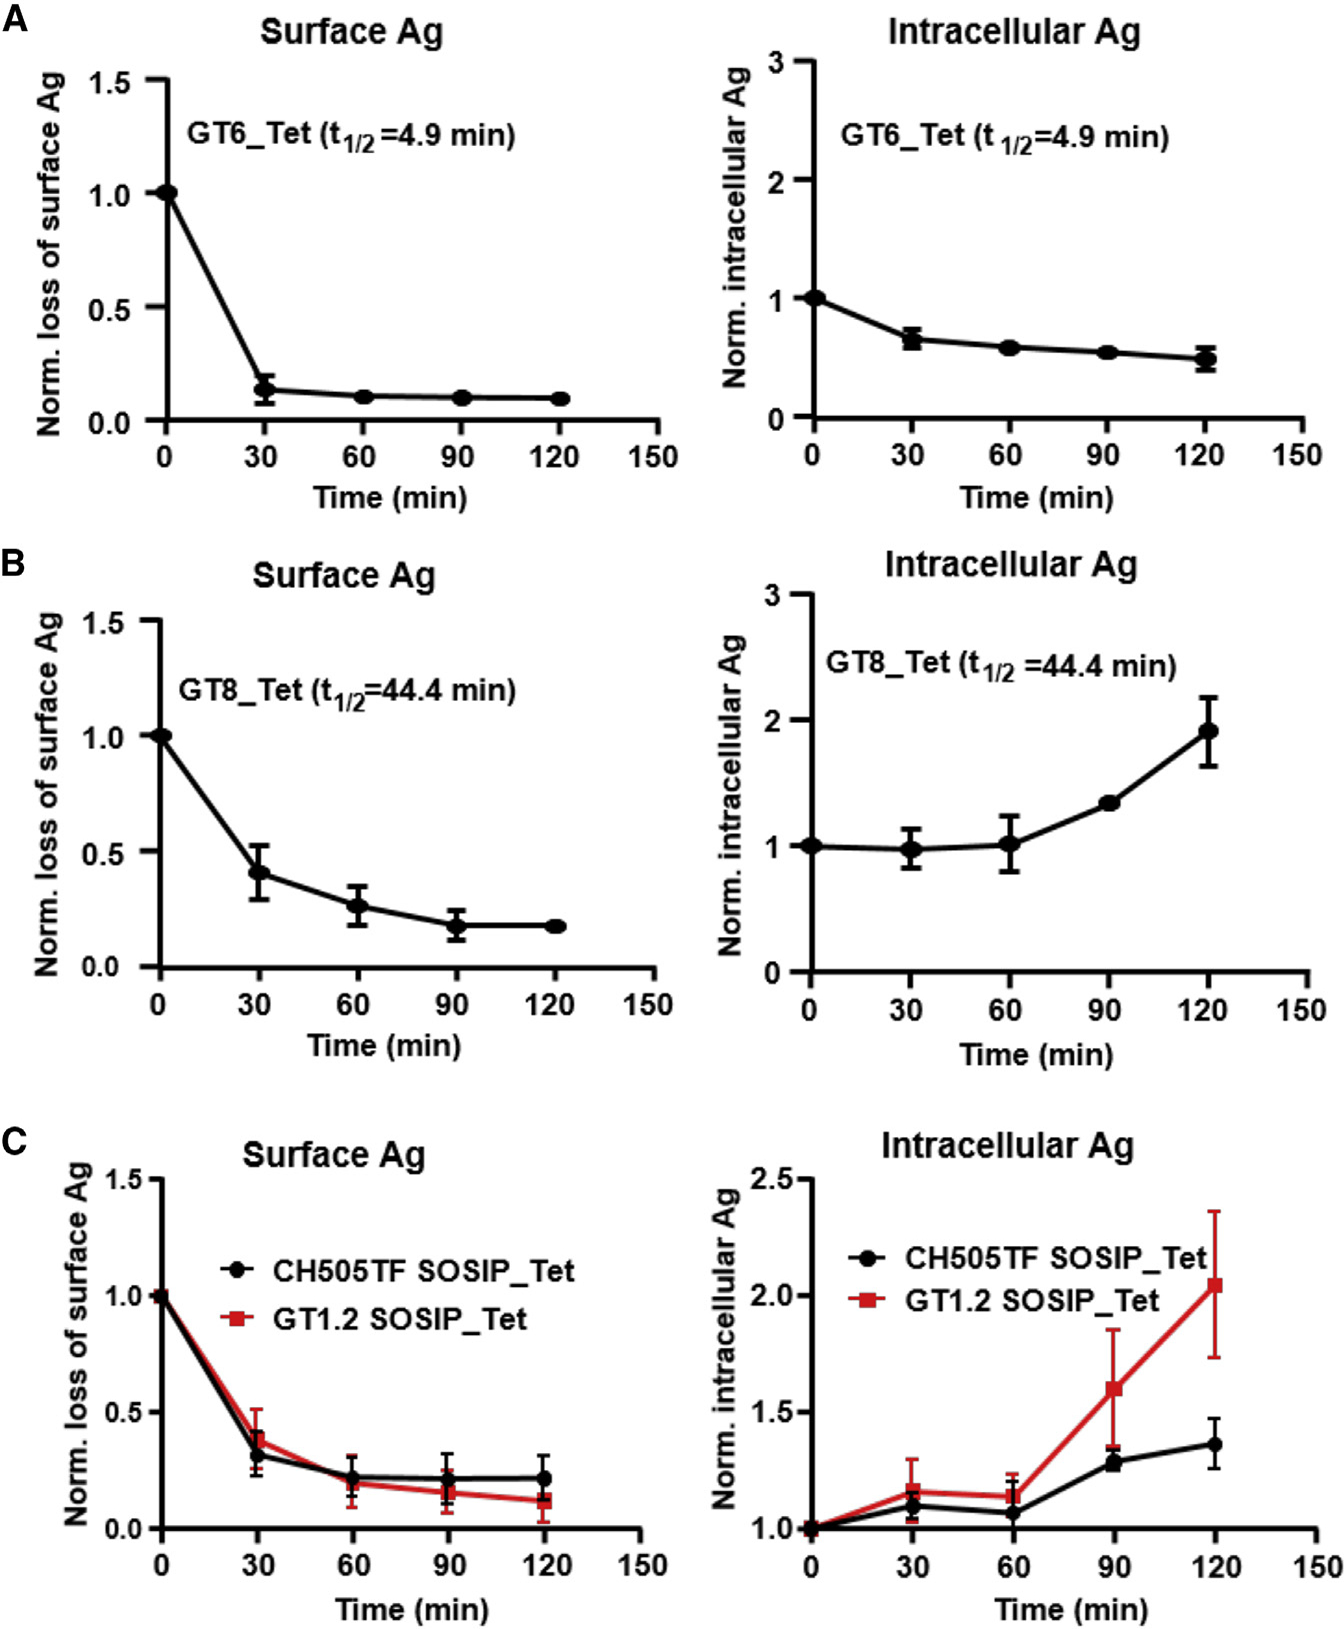
(A–C) The loss of CH31 IgM BCR bound antigen (left panel) and the level of intracellular Env proteins (right panel) following exposure to the indicated proteins over time. Surface loss and internalization of tetramers of GT6 (A) or GT8 (B) or trimers (CH505TF, GT1.2) (C) were measured by flow cytometric analysis following exposure of each protein to CH31 IgM Ramos cells over a 2 h period. Plotted data in the figure are means of normalized MFI values of antigen-treated cells to unstimulated cells or 0 min control calculated from three independent experiments. t1/2 values of Env-CH31 bound complex are indicated in each plot. Data presented are means with standard deviation values from three independent measurements at each time point.