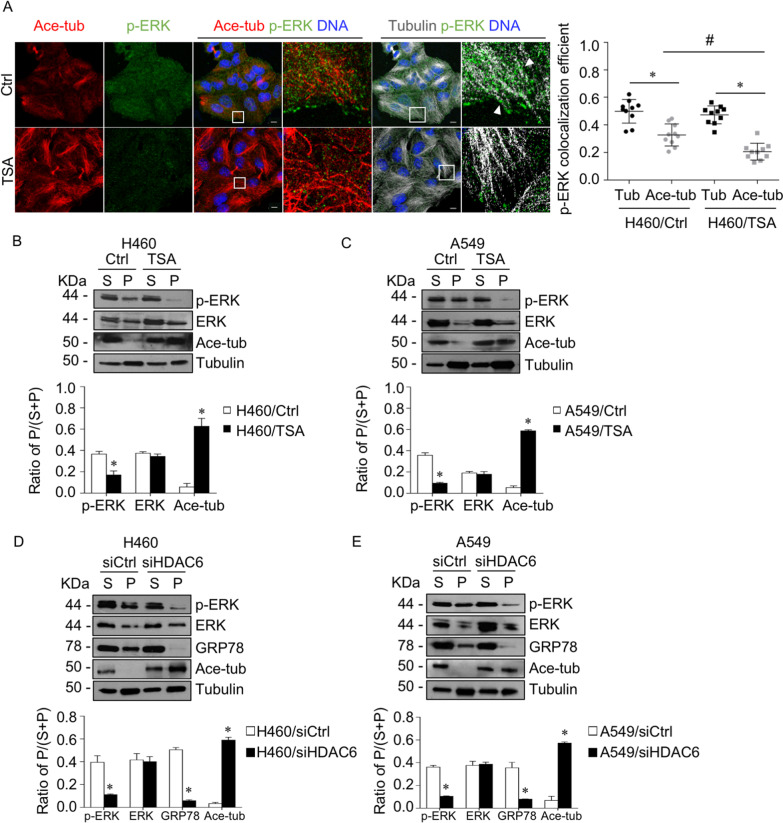
Fig. 4.
Suppression of HDAC6 prevented the microtubule-p-ERK interaction. A Immunofluorescence staining for p-ERK (green), acetylated tubulin (red), α-tubulin (gray), and DNA (blue) in H460 cells treated with or without TSA (5 µM TSA) for 4 h. Box areas are enlarged. The head arrows indicate p-ERK puncta overlapping with α-tubulin. Colocalization of p-ERK with acetylated tubulin or α-tubulin was calculated as Manders' coefficient. The plot shows individual data and is presented as the mean ± SEM. *p < 0.05; #p < 0.05 (n = 10). Scale bar is 10 µm. B H460 and C A549 cells were treated with 5 µM TSA for 4 h. The lysate was separated into soluble (S) and pellet (P) fractions using a microtubule sedimentation assay and analyzed for p-ERK, ERK, acetylated tubulin, and α-tubulin by immunoblotting. The ratio of the pellet to the total fraction was calculated. Data are presented as the mean ± SEM. *p < 0.05 vs. control cells (n = 3). D H460 and E A549 cells were transfected with siRNA against HDAC6 (siHDAC6, 50 nM) or control siRNA (siCtrl). Cells were lysed, separated into soluble (S) and pellet (P) fractions using a microtubule sedimentation assay, and analyzed for p-ERK, ERK, acetylated tubulin, GRP78, and α-tubulin by immunoblotting. The ratio of the pellet to the total fraction was calculated. Data are presented as the mean ± SEM. *p < 0.05 vs. siCtrl cells (n = 3)

