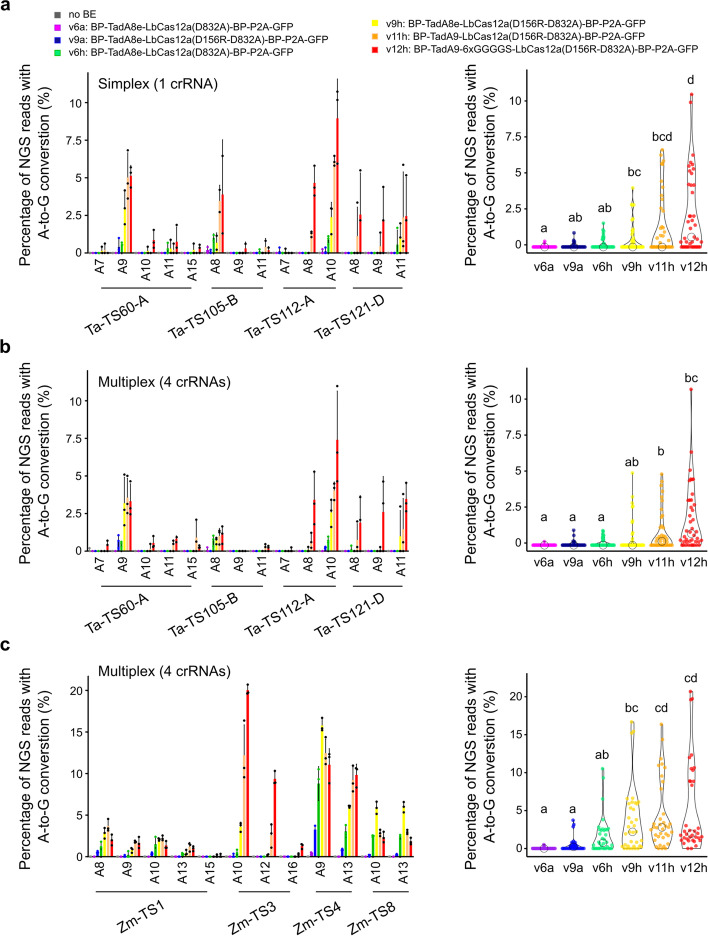
Fig. 3.
Validation of Cas12a-ABE activity at endogenous targets in wheat and maize. a, c Simplex (a) or multiplex (b, c) base editing efficiencies of six LbCas12a-ABE configurations as measured by the proportion of NGS reads converted from A-to-G in wheat (a, b) or maize (c). Different Cas12a-ABE versions are labeled with number and letters referring to Fig. 2a, b. Barplot displays A-to-G conversion rates at individual on-target target. x-axis indicates targeted adenines at different positions along the protospacer, with the PAM-adjacent base being position 1. Editing rates were calculated from two or three independent biological replicates that are depicted as dots on barplots. Violin plots represent pooled efficiencies at all targets for individual base editor versions. Statistical significance is calculated by a Kruskal-Wallis test followed by a Dunn post hoc test at threshold p<0.05

