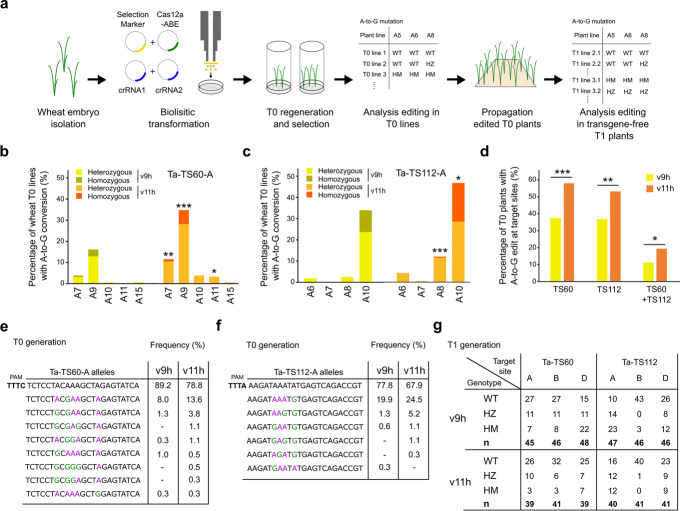
Fig. 4.
Validation of Cas12a-ABE activity in stable wheat plants. a Schematic of stable wheat plant transformation and genotyping. b, c Percentage of T0 wheat plants with A-to-G base editing at independent positions of the target as measured by NGS. Two Cas12a-ABEs (v9h and v11h) are compared at TS60-A (b) and TS112-A (c) (v9h: n=155; v11h: n=182 at TS60-A and v9h: n=156 ; v11h: n=182 at TS112-A). Percentage of T0 wheat plants with heterozygous (editing rates between 25 and 70%) and homozygous mutations (higher than 70%) are displayed. d Percentage of T0 wheat plants carrying at least one mutation in at least one subgenome at TS60 or TS112 loci (n=154–157 for v9h and n=182–184 for v11h). Asterisks depict a significant difference in editing efficiency between v9h and v11h as measured by z-score test for two proportions (*: p<0.05; **: p<0.01; ***: p<0.001). e, f Allelic frequency of base edited T0 wheat plants at TS60-A (e) (v9h: n=314 alleles; v11h: n=368 alleles) or TS112-A (f) (v9h: n=316 alleles; v11h: n=368 alleles). Base-edited nucleotides are marked in green. g Distribution of T1 Cas12-ABE transgene-free plants with A-to-G edits in the three subgenome targets (A, B, D). 12 independent T1 lines were analyzed. WT, wild type; HZ, heterozygous; HM, homozygous

