Fig. 5.

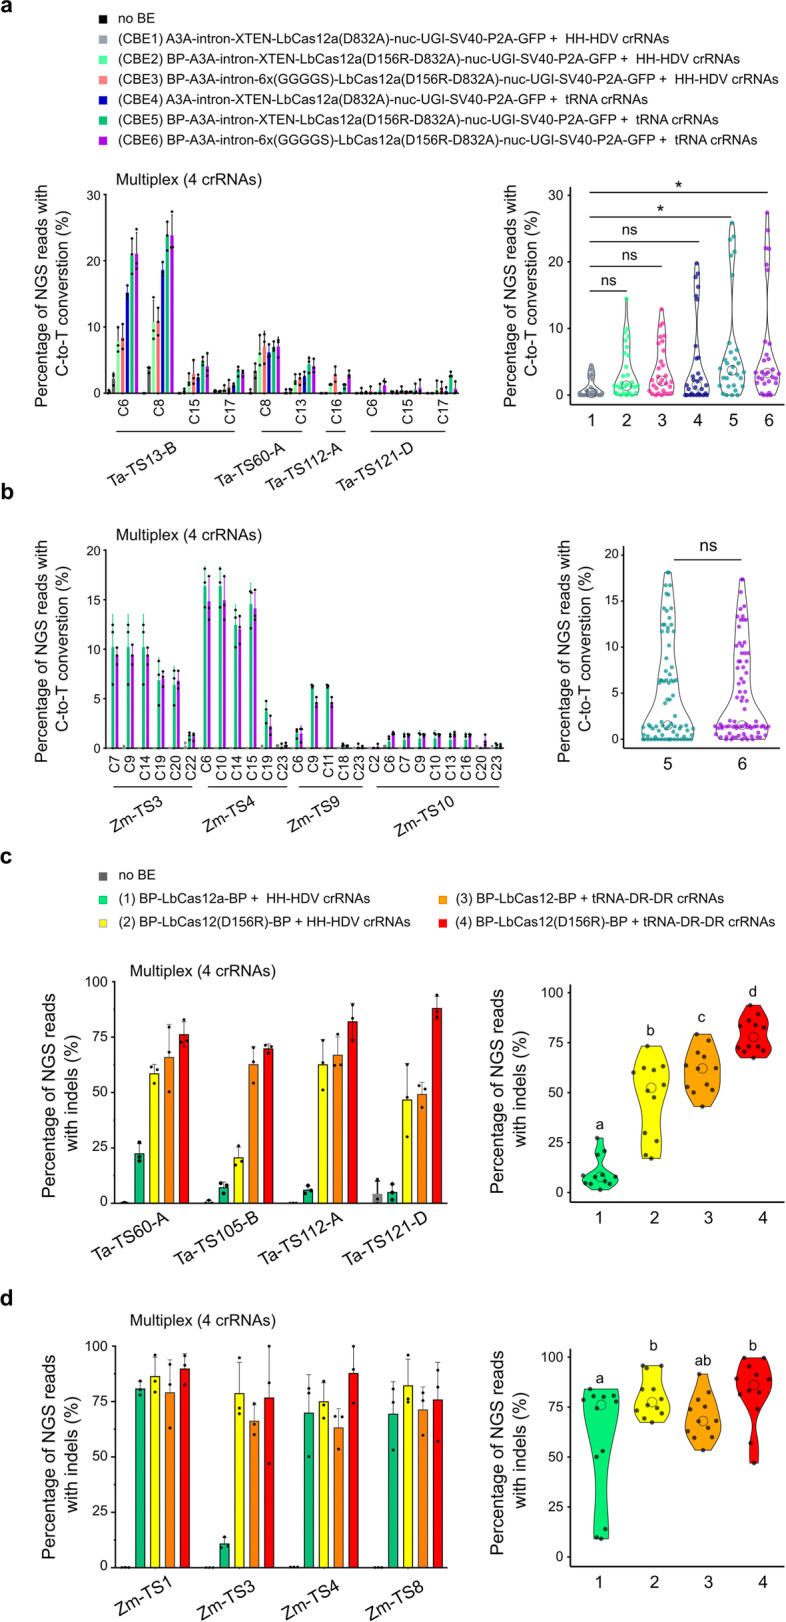
Building a Cas12a toolset with optimized components. a-b, Multiplex C-to-T base editing efficiencies of six LbCas12a-CBE versions in wheat (a) or two versions in maize (b). The x-axis indicates targeted cytosines at different positions along the protospacer, with the PAM-adjacent base being position 1. Violin plots represent pooled efficiencies at all targets for individual base editor architectures. c-d, Indel rates for four versions of LbCas12a nuclease in wheat (c) or maize (d). Barplots display indel rates at individual homeolog on-targets. Violin plots represent pooled indel rates at all targets for individual LbCas12a architectures. Editing rates were calculated from three independent biological replicates that are depicted as dots on barplots (a-d). Statistical significance in a is calculated by a Kruskal-Wallis test followed by a Dunn post hoc test (*: p<0.05); in b using a Mann-Whitney test; in c-d by a two-way ANOVA test with a Tukey HSD post hoc test at threshold p<0.05
