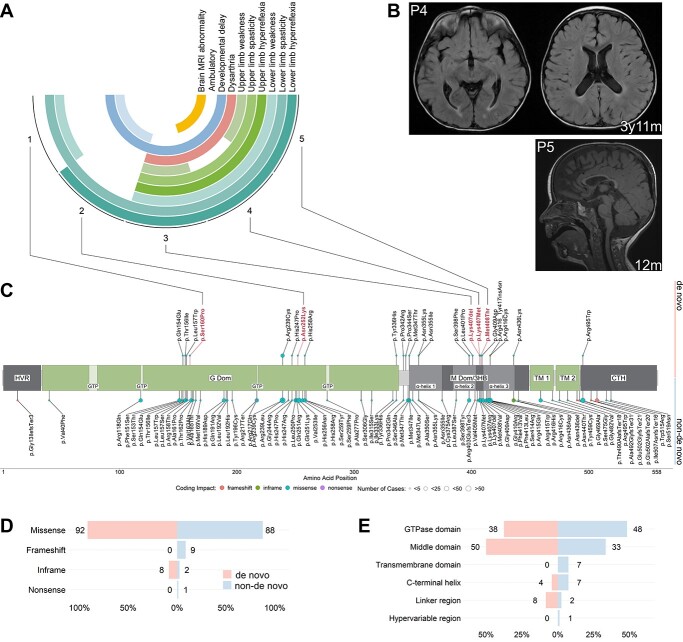
Figure 1.
Phenotypes observed in probands and schematic of the atlastin-1 primary protein structure with novel variants and variant distribution. (A) Summary of the phenotypes observed in the five probands with de novo variants. Outer circle: proband number (Supplementary Material, Tables S1 and S2). Second to 11th circles: clinical symptoms, phenotype. White cells represent normal findings/absence of phenotype. (B) MR images of patients 4 and 5. Top row: Axial T2-weighted FLAIR images showing periventricular white matter changes in patient 4 at the age of 3 years and 11 months. Bottom right: Sagittal T1-weighted image showing thinning of the anterior aspects of the corpus callosum in patient 5 at the age of 12 months. (C) Disease-associated variants identified in the literature are annotated along the protein with dot color representing coding impact and dot size representing the number of cases identified. De novo variants are depicted towards the top and non-de novo variants downwards. Variants found in the probands appear in bold red letters. (D) Frequencies of coding impacts in de novo and non-de novo ATL1 variants depicted as percentage of all distinct variants shown in (C). (E) Frequencies of mutations in the functional domains of atlastin-1 depicted as percentage of all distinct variants shown in (C).

