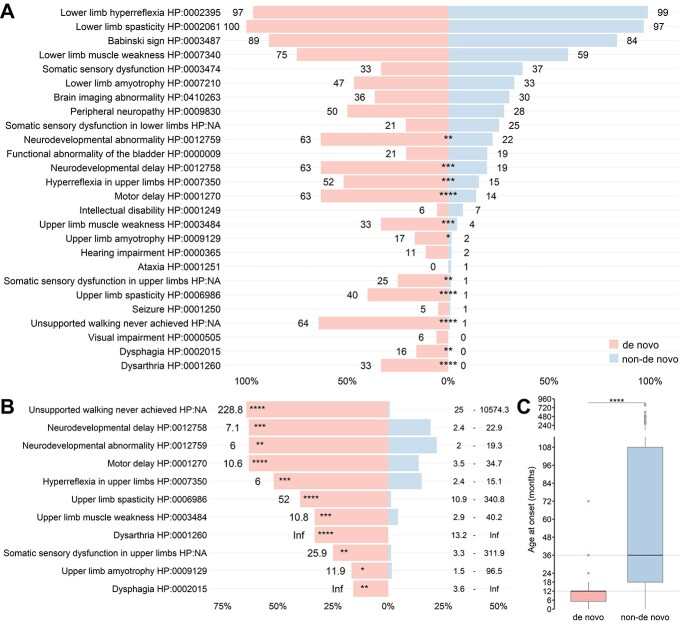
Figure 2.
Comparison of the phenotypic spectrum in patients with de novo and non-de novo ATL1 variants. A total of 536 patients (nde novo = 31, nnon-de novo = 505; including the five probands identified in this study) were examined. (A) Frequencies of phenotypic features depicted as percentage of all patients (only patients who were explicitly examined for the feature were included in this retrospective analysis). Rounded percentages are depicted next to each bar. Statistical testing was performed using Fisher’s exact test followed by multiple hypothesis testing correction using the Benjamini–Hochberg procedure. (B) Estimated odds ratios for 11 phenotypic features significantly more frequent in patients with de novo variants compared to patients with inherited variants. Estimated odds ratios depicted to the left of each bar and 95%-confidence intervals depicted to the right end of each line. (C) Patients with de novo variants have a significantly earlier onset of symptoms (nde novo = 26, median = 12 months [IQR = 6.75]) compared to patients with non-de novo variants (nnon-de novo = 257, median = 36 months, [IQR = 93]); Mann–Whitney-U, P = 1.9e−9.

