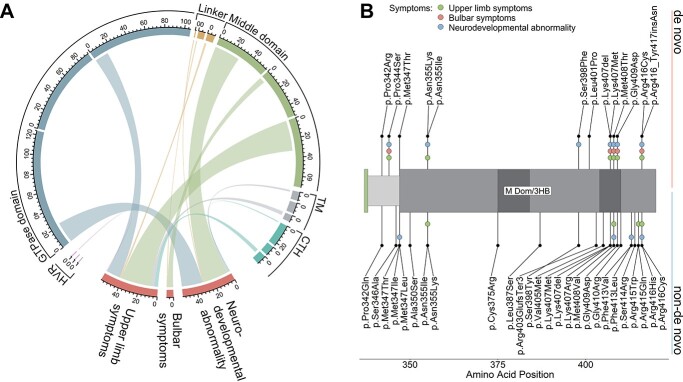
Figure 3.
Variants associated with complex phenotypes are unevenly distributed among functional ATL1 domains. (A) Chord diagram depicting association of variant localization with the three symptom categories enriched in patients with de novo variants (Supplementary Material, Fig. S3). Each subsector reflects the absolute number of patients examined for symptoms of the respective symptom category, in relation to respective variant locations. Clockwise order of subsectors for each domain sector: developmental abnormality, bulbar symptoms, upper limb symptoms. Chord widths reflect the absolute number of patients positive for at least one symptom of the respective symptom category. (B) Section of the atlastin-1 primary structure depicting the linker region and N-terminal middle domain. De novo variants are depicted towards the top and non-de novo variants downwards. Colored dots indicate symptoms associated with respective variants. Abbreviations: HVR, hypervariable region; M Dom/3HB, middle domain/3 helix bundle; TM, transmembrane domain; CTH, C-terminal helix.

