Figure 4.

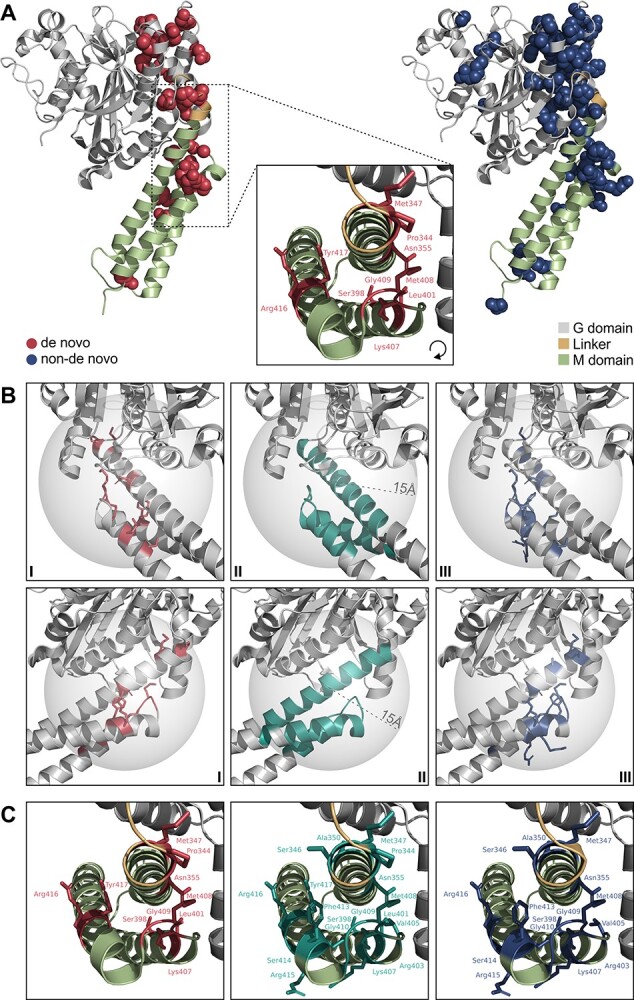
Variant distribution in three dimensional atlastin-1 structures. De novo variants associated with distinct, severe phenotypes, three-dimensionally cluster in the linker region and N-terminal M domain. (A) Wildtype prefusion GDP/Pi- and Mg2+-bound atlastin-1 (PDB 3Q5E, residues 1–447) with sites of de novo variants depicted as red spheres (left) and non-de novo variants as blue spheres (right). Black box indicating zoom-in view of the linker/middle (M) domain region, where variants associated with severe phenotypes cluster. (B) Localization of the cluster is approximated by creating the smallest possible sphere (radius 15 Å) containing all de novo variants associated with severe symptoms in this region (I, II). Hereby, non-de novo variants located within the cluster are identified (III). Protein region depicted from two different viewing angles (first and second row of panels). (C) Pathogenic variants located within the cluster. De novo variants depicted in red (left), non-de novo variants in blue (right) and all pathogenic variants within the cluster in teal (middle).
