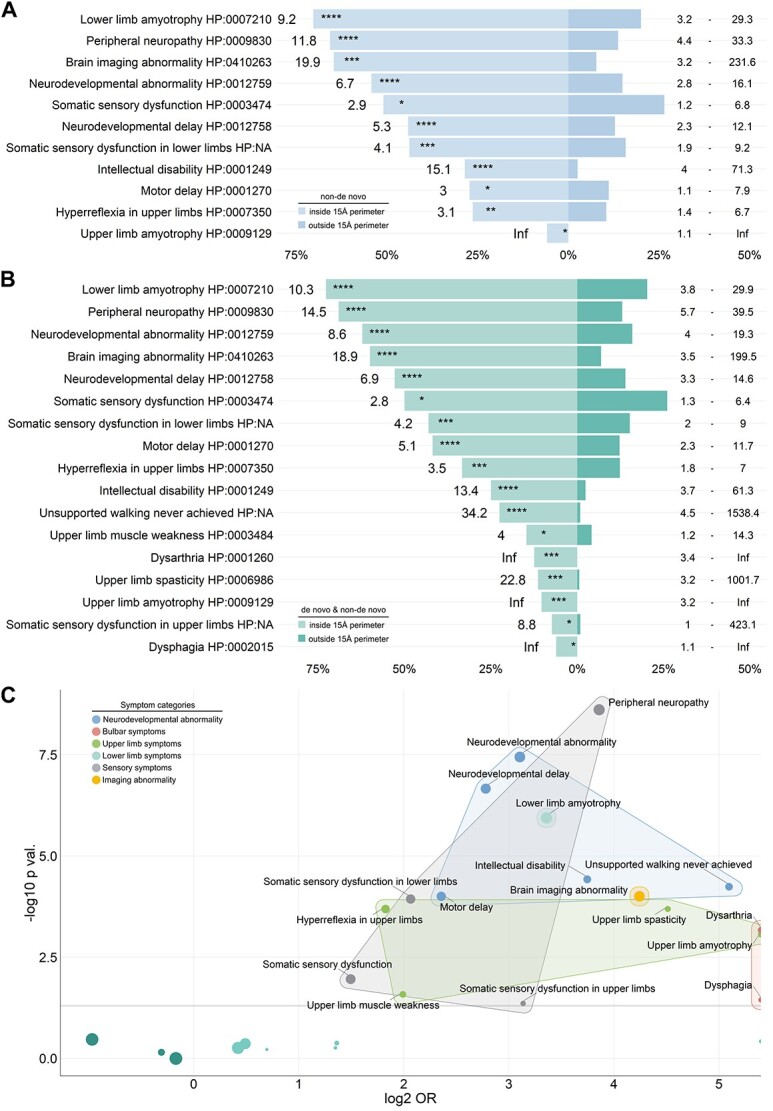
Figure 5.

ATL1 variants located within the modelled cluster are associated with distinct and severe phenotypes. (A) Frequencies and odds ratios for phenotypic features significantly more frequent in patients with non-de novo variants located inside compared to variants located outside the perimeter of the modelled cluster. Estimated odds ratios depicted to the left and 95%-confidence intervals depicted to the right of each bar. Bar lengths reflect the percentages of patients exhibiting the respective clinical feature (only patients who were explicitly examined for the feature were included; nnon-de novo|inside cluster = 159, nnon-de novo|outside cluster = 346). (B) Frequencies and odds ratios for phenotypic features significantly enriched in patients with variants located inside compared to variants located outside the perimeter of the modelled cluster. Estimated odds ratios depicted to the left and 95%-confidence intervals depicted to the right of each bar. Bar lengths reflect the percentages of patients exhibiting the respective clinical feature (only patients who were explicitly examined for the feature were included; ninside cluster = 172, noutside cluster = 364). (C) Clinical features significantly enriched in patients with variants located within the modelled cluster can be assigned to five major categories. Estimated odds ratios plotted against P values for phenotypic features in patients with variants located inside compared to variants located outside the perimeter of the modelled cluster (significantly enriched features are labelled).
