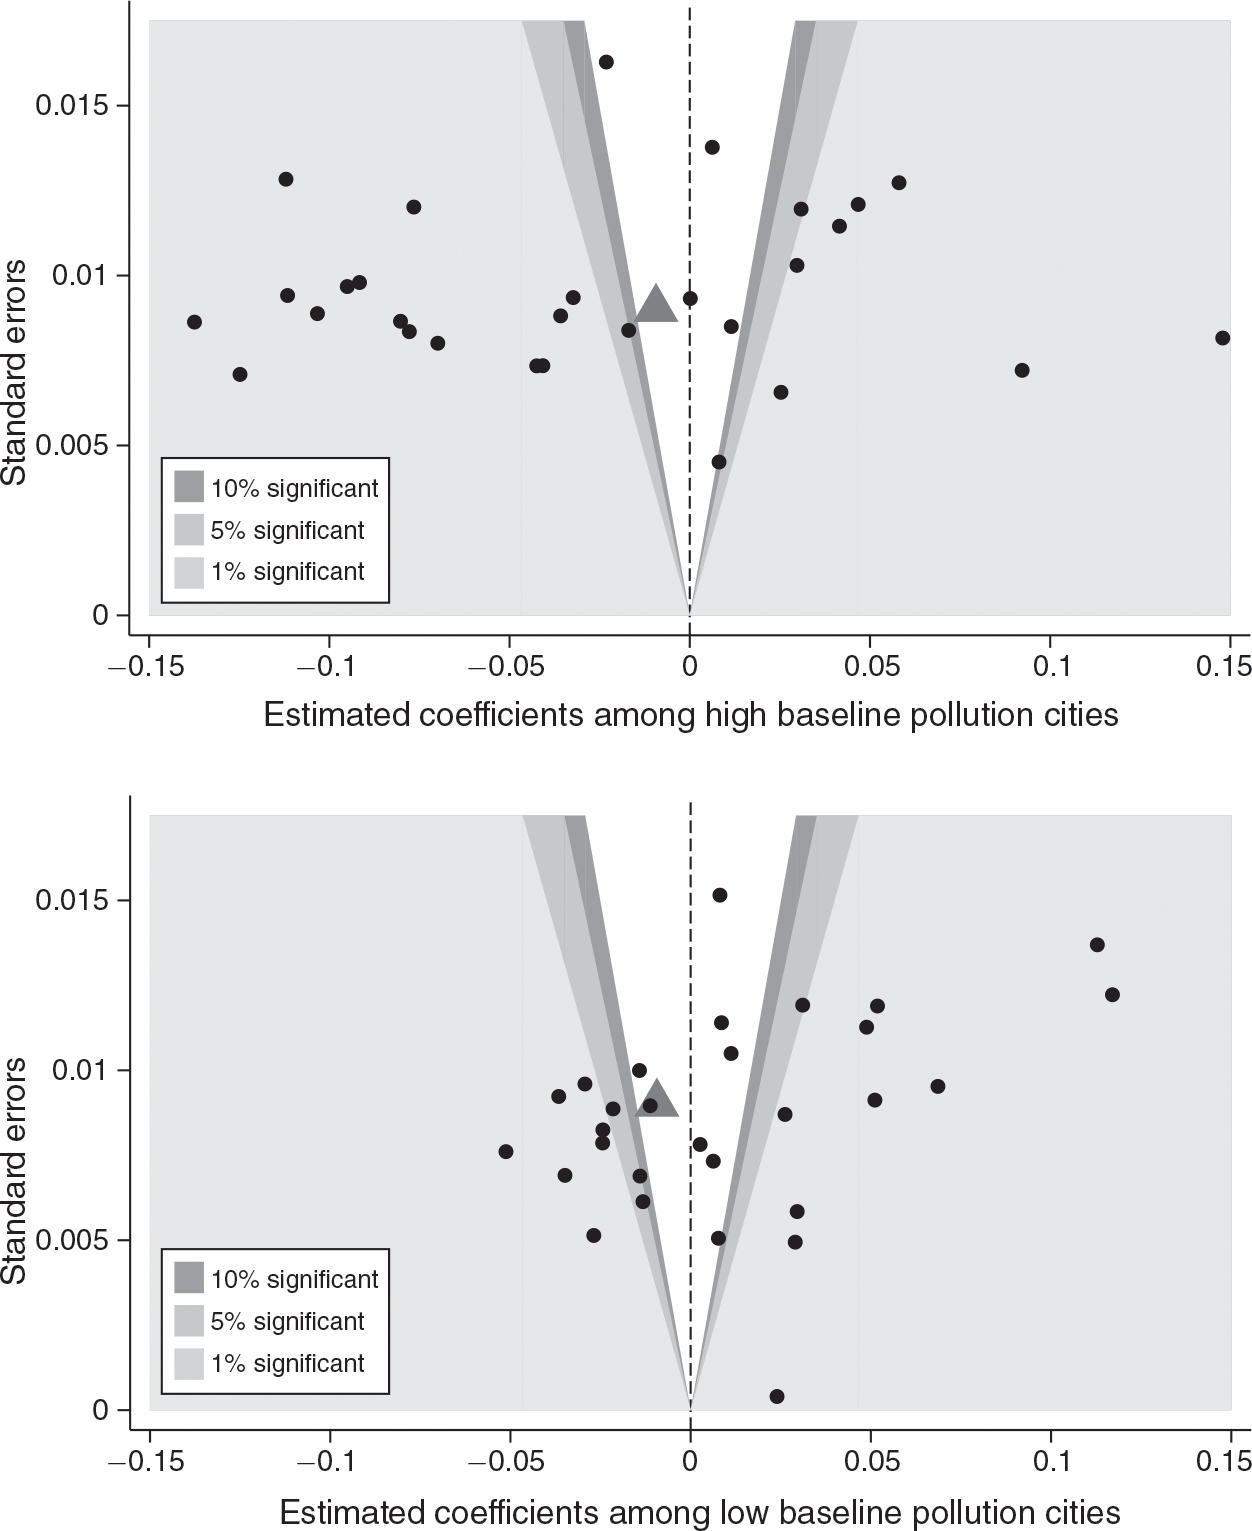
Figure 5. Heterogeneous Treatment Effects by High and Low Baseline AOD Levels.

Notes: These funnel graphs show the 58 city-specific subway effects as small circles based on equation (4), where the coefficient α is allowed to vary by city. The x-axis shows coefficient estimates, the y-axis shows standard errors. The region in white contains estimates that are not significantly different from zero. Dark, medium, and light gray regions are different from zero at 10 percent, 5 percent, and 1 percent in two-sided tests, respectively. The top (bottom) panel shows estimates for cities with above (below) median AOD levels at baseline. In both figures, the large triangle indicates the overall sample mean effect estimated in Table 2, column 5. Controls are as in column 5 of Table 2. Standard errors are clustered at the city level.
