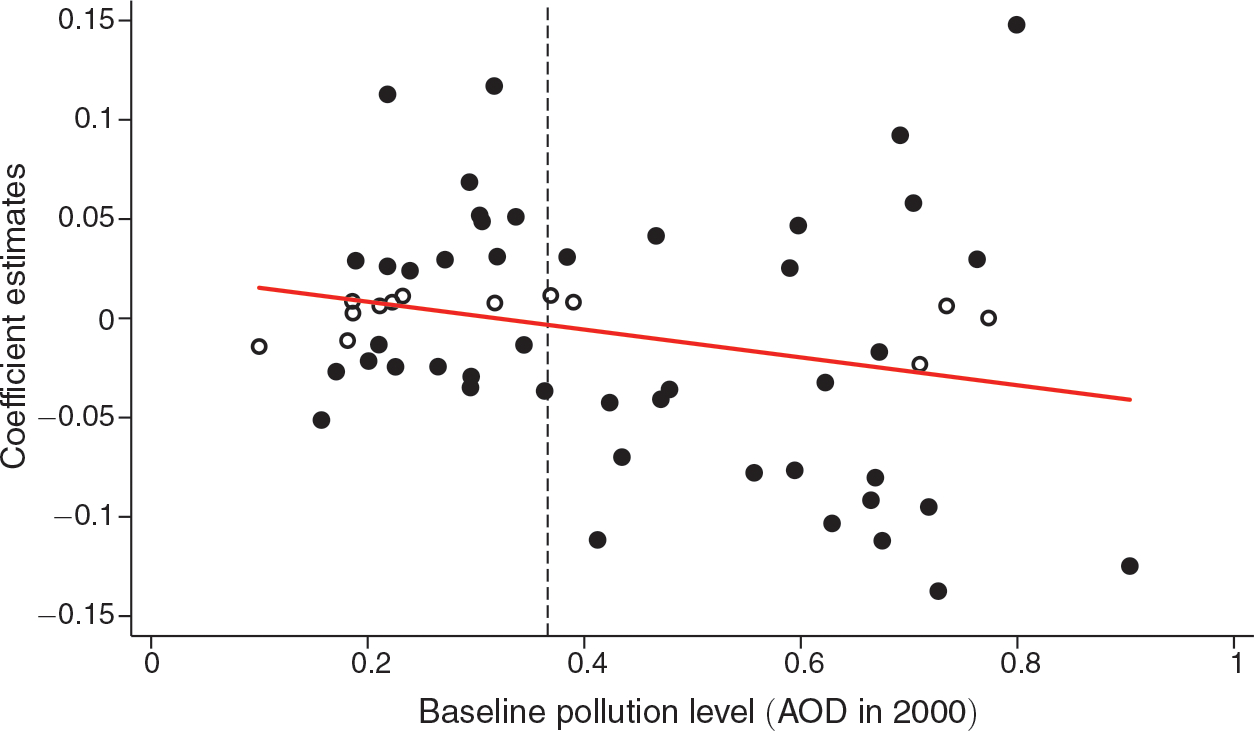
Figure 6. Treatment Effects and Initial AOD Levels.

Notes: This figure shows the 58 city-specific subway effects as small circles based on equation (4) where the coefficient α is allowed to vary by city. Dark dots are significant at the 5 percent level. The x-axis shows initial AOD level in 2000, the y-axis shows coefficient estimates. The solid line shows a linear fit of the dots and the vertical dashed line shows the partition of the sample into below and above median initial AOD level. Standard errors are clustered at the city level.
