
Extended Data Fig. 10 ∣. clampFISH 2.0 detects RNAs In presumptive human cells in tissue.
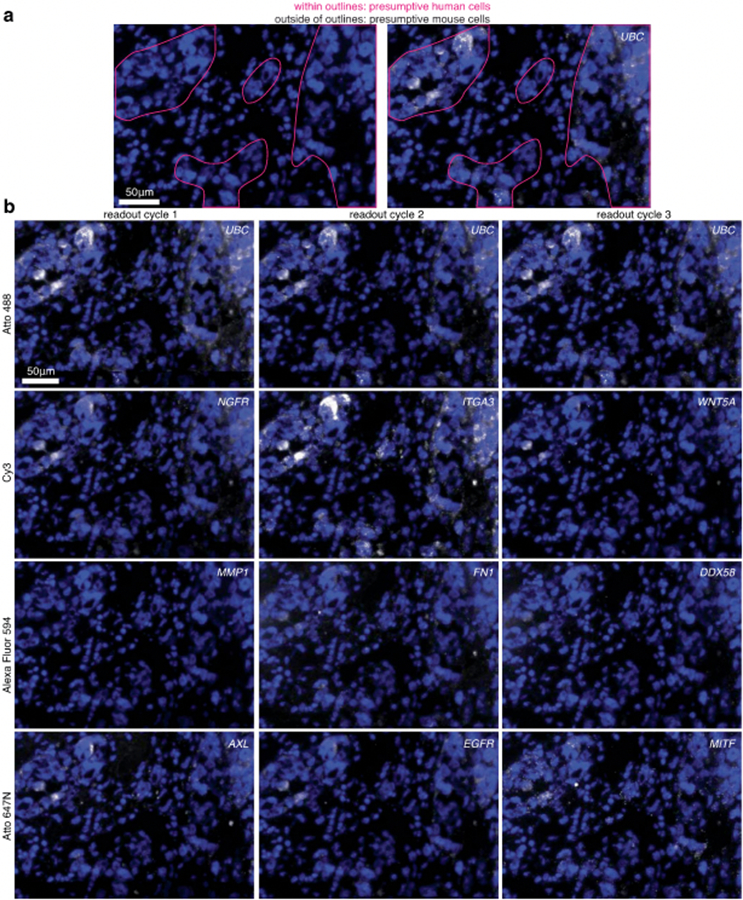
clampFISH 2.0 was performed in a 6μm fresh frozen tissue section of a dissected tumor, derived from human WM989-A6-G3-Cas9-5a3 cells injected into a mouse and fed chow containing the BRAFV600E inhibitor PLX4720. Shown are stitched maximum intensity projections of 20X Image stacks with 5 z-planes at 1.2μm z-step Increments. (a) Pink outlines around regions containing mostly presumptive human cells, demarcated based on nuclear morphology, showing DAPI staining alone (left) and DAPI with UBC clampFISH 2.0 signal overlaid (right), where images are from readout cycle 2. (b) clampFISH 2.0 scaffolds for 10 genes were probed across readout cycles 1 (left), 2 (middle), and 3 (right), where the UBC scaffold was probed each round as a positive control. The dyes on each readout probe set were (top to bottom): Atto488, Cy3, Alexa Fluor 594, and Atto647N. The experiment was performed twice with similar results.