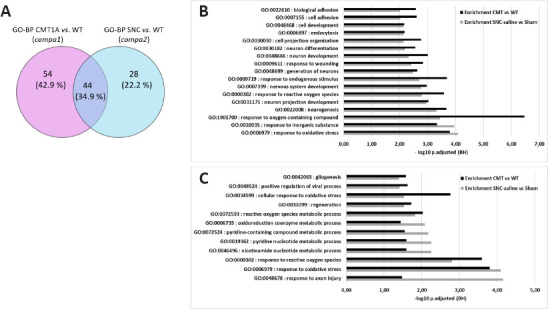
Figure 14.

Overlap of GO-BP lists between compa1 and compa2.
(A) Venn diagram of the two collections of GO-BP terms shows 44 terms (34.9 %) common to the two comparisons. (B) Histogram showing 17 out of 44 GO-BP terms that have P-adjusted < 0.01 in both enrichment analyses. (C) Histogram showing 12 out of 44 GO-BP terms filtered by fold enrichment > 4 in both enrichment analyses. compa1: comparison between CMT1A and WT rats at 3 months old; compa2: comparison between SNC and the WT rats 5 weeks after injury. CMT1A: Charcot-Marie-Tooth-1A; GO-BP: Gene Ontology Biological Process; SNC: sciatic nerve crush; WT: wild-type.
