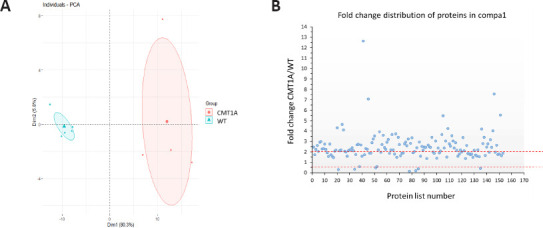
Figure 2.

Data visualization of proteins sorting from compa1 (153 proteins).
(A) Categorization of protein expression using principle component analysis (PCA) analysis: WT (blue dots) and CMT1A (red dots) data are well separated. Therefore their data are well distinct, although a more spread cluster is observed in the CMT1A group. A greater heterogeneity was observed in CMT1A data. (B) Distribution of proteins as upregulated or downregulated depending on fold change ratios (mean CMT1A/mean WT). compa1: Comparison between CMT1A and WT rats at 3 months old. CMT1A: Charcot-Marie-Tooth-1A; WT: wild-type.
