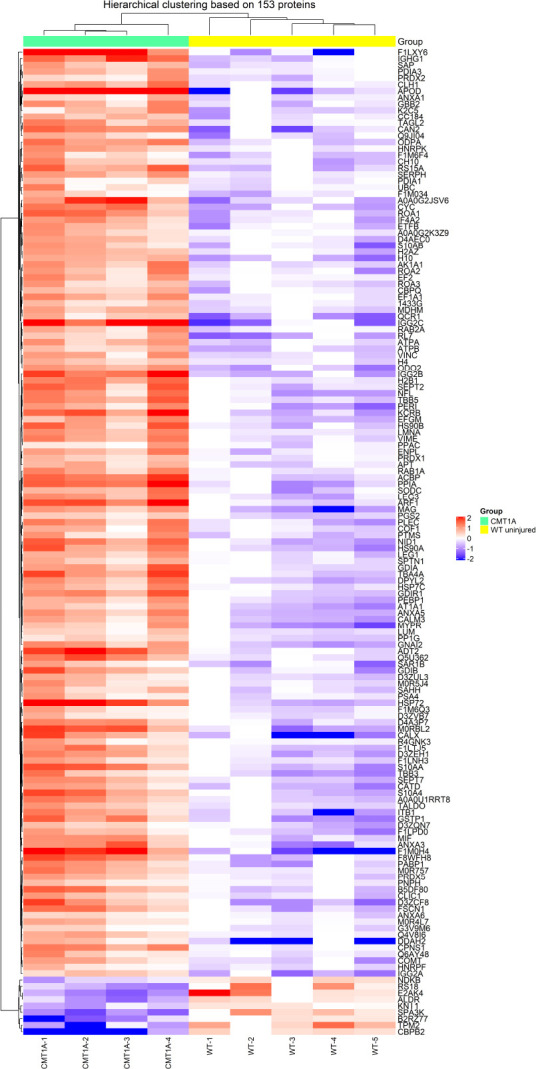
Figure 3.

Heat map of CMT1A versus WT (compa1).
Hierarchical clustering of differentially expressed proteins in the two groups WT and CMT1A. Each column in the heat map represents a sample (rat), and each row represents a protein expression level. Proteins are grouped by hierarchical clustering based on their expression patterns. A color scale was used to aid the visualization: in CMT1A vs. WT groups, overexpressed proteins in red and under-expressed proteins in purple. compa1: Comparison between CMT1A and WT rats at 3 months old. CMT1A: Charcot-Marie-Tooth-1A; WT: wild-type.
