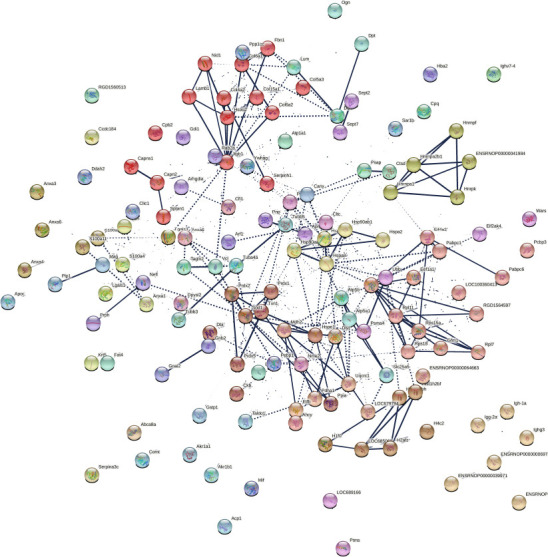
Figure 4.

Protein network data of compa1 by STRING database (Rattus norvegicus).
Analysis of protein-protein interactions (PPI) of 153 significantly different proteins in compa1 study (CMT1A vs. WT). Nodes represent individual proteins, edges represent protein-protein associations. Average local Markov clustering coefficient = 0.505. Dotted lines represent edges between clusters. The thickness of the line is proportional to the edge confidence. Each color represents a cluster of proteins. There are 37 clusters based on enrichment pathways. Each cluster, created by Markov Clustering (MCL), corresponds to a group of enrichment pathways such as Gene Ontology, Kyoto encyclopedia of genes and genomes (KEGG), or Reactome. compa1: comparison between CMT1A and WT rats at 3 months old. CMT1A: Charcot-Marie-Tooth-1A; WT: wild-type.
