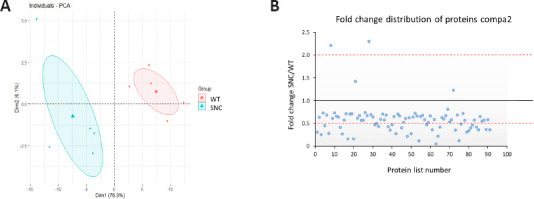
Figure 8.

Data visualization of proteins sorted from compa2 (92 proteins).
(A) Principal component analysis (PCA) shows that WT (red points) and SNC (blue points) data are well separated, therefore their data are well distinct. A heterogeneity is shown in SNC data. (B) Distribution of proteins as up or downregulated depending on fold change ratios (mean SNC/mean WT). compa2: Comparison between SNC and the WT rats 5 weeks after injury. SNC: Sciatic nerve crush; WT: wild-type.
