Figure 4.

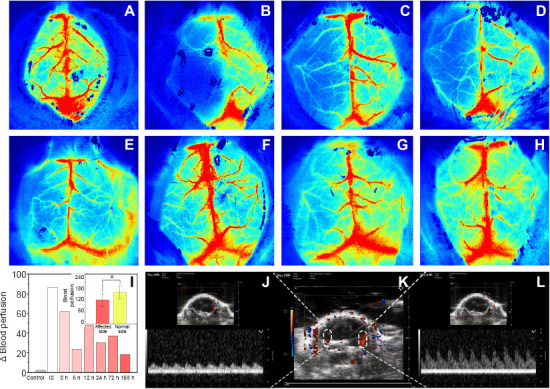
Monitoring using laser-speckle blood flow imaging system and the ultrasound/photoacoustic imaging system.
(A–H) During cerebral ischemia, cerebral blood perfusion on the affected (left) side was almost zero, which indicated that the ischemia model was successfully constructed. One hour after induction of ischemia, cerebral blood flow was experimentally restored and monitored using a laser-speckle blood flow imaging system over 168 hours. Cerebral blood perfusion in the affected side increased over time: control (A), ischemic stroke (B), before reperfusion (C), 6 hours after reperfusion (D), 12 hours after reperfusion (E), 24 hours after reperfusion (F), 72 hours after reperfusion (G), and 168 hours after reperfusion (H). Red indicates local perfusion. (I) Change in total perfusion differed significantly between the affected and healthy sides in all mice (*P < 0.05); Change in perfusion in control mice, ischemic stroke (IS) mice, and after reperfusion at various time points is also shown. Data are expressed as means ± SD (n = 3) and were analyzed using one-way repeated measures analysis of variance. (J) Pulse wave Doppler showed decreased flow in the left middle cerebral artery. (K) Color Doppler flow imaging showed normal perfusion in the right middle cerebral artery. The perfusion signal in the left middle cerebral artery was thin and discontinuous. (L) Flow in the right middle cerebral artery was normal.
