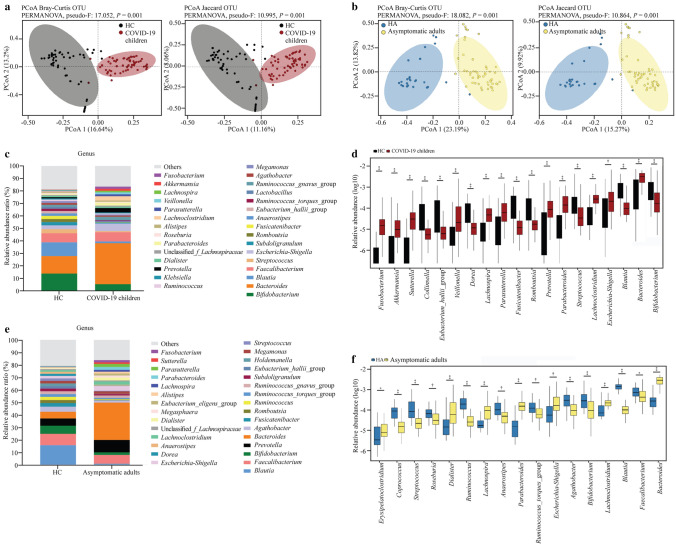
Fig. 1.
Altered gut microbiota diversity and compositions of COVID-19 children and asymptomatic caregivers in comparison with healthy children (HC) and healthy adults (HA). a, b Beta diversity analyzed by PCoA of Bray–Curtis distance and Jaccard between groups. Each dot represents one sample, and the ellipses represent groups. Groups were compared by using the PERMANOVA method; c, e relative abundance ratio of bacteria at the genus level in different groups. The top 30 abundant genera are indicated; d, f genera with significant differences between groups. The relative abundances are shown in log10. Statistical significance was assessed by using the Wilcoxon rank-sum test, with *P ≤ 0.05, †P ≤ 0.01, ‡P ≤ 0.001, §P ≤ 0.0001. COVID-19 2019, PCoA principal coordinate analysis, OTU operational taxonomic units, PERMANOVA permutational multivariate analysis of variance

