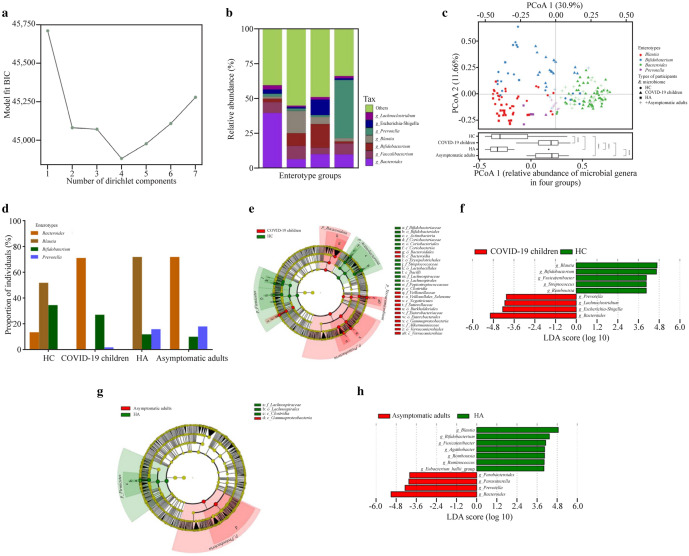
Fig. 2.
Bacterial features associated with SARS-CoV-2 Omicron infection. a Information criteria from the DMM community typing of the joint microbiome dataset of all subjects (186 samples) showing the optimum (minimum BIC) at four Dirichlet components; b the barplot showing the four enterotype groups identified by DMM, with average relative abundance of the representative genera in each enterotype group; c principal coordinate analysis visualization of interindividual differences (Bray–Curtis distance) in relative microbiome profiles in each group (Wilcoxon rank-sum test, with §P ≤ 0.0001); d barplot showing the enterotype prevalence distributions in each group; e, g cladogram generated from LEfSe analysis showing the relationship between taxa (from the inner ring to the outer ring, the grades represent the phylum, class, order, family, genus, and species). Each dot represents a taxonomic hierarchy; f, h LEfSe identified the taxa with the greatest differences in abundance between the two groups. Bacteria with an LDA score > 3 were plotted. DMM Dirichlet multinomial mixtures, BIC Bayesian information criterium, LDA linear discriminant analysis, HC healthy children, HA healthy adults, COVID-19 coronavirus disease 2019, SARS-CoV-2 severe acute respiratory syndrome coronavirus 2

