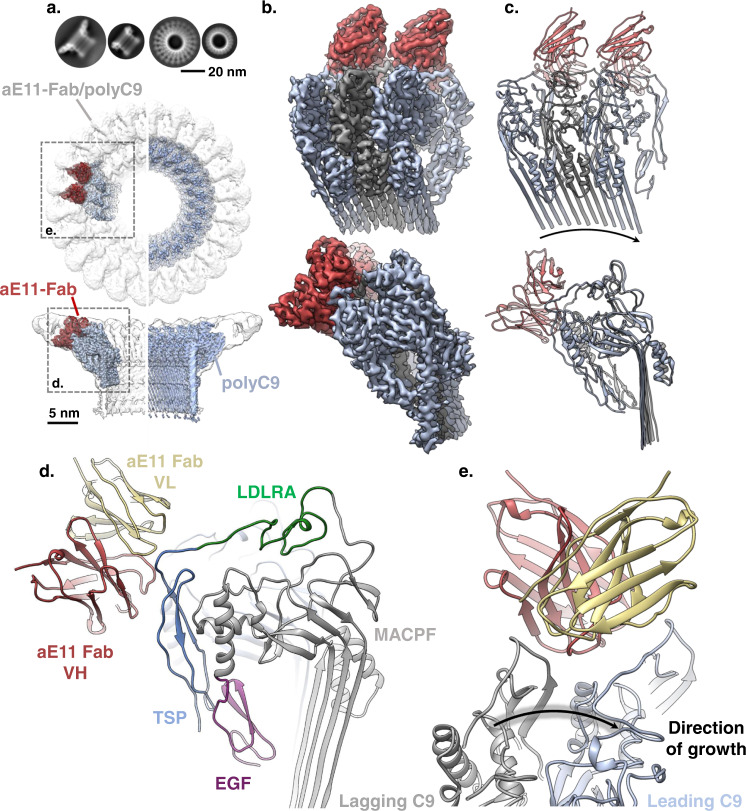
Fig. 1. Cryo-EM reconstruction of aE11-Fab/polyC9.
a Above: comparisons of 2D class averages between polyC9 alone and aE11-Fab/polyC9. Below: 3D density map comparison between top-down and side orientations of the full cryo-EM maps of the aE11-Fab/polyC9 complex (transparent grey surface) and unbound polyC9 (blue). Left: focused refinement of C9 trimer (blue) with aE11-Fab (red) positioned in the global map of aE11-Fab/polyC9 (transparent grey). Right; unbound polyC9 alone (EMDB: 7773). b Focused view of the boxed region from (a; oblique and side views), three C9 subunits, and two aE11-Fabs are shown as isosurfaces. c Corresponding cartoon representation of the atomistic model derived from (b). The direction of MAC assembly is indicated by the arrow. d The positions of the heavy (H) and light (L) chains of aE11-Fab, in red and beige, respectively, and domains of the C9 subunit: MACPF (grey) and ancillary domains TSP (blue), LDLRA (green), and EGF (purple). e Top-down view of the aE11-Fab wedged between the two C9 protomers, defined as leading (light blue) and lagging (grey) subunits. Black arrow shows direction of MAC assembly.

