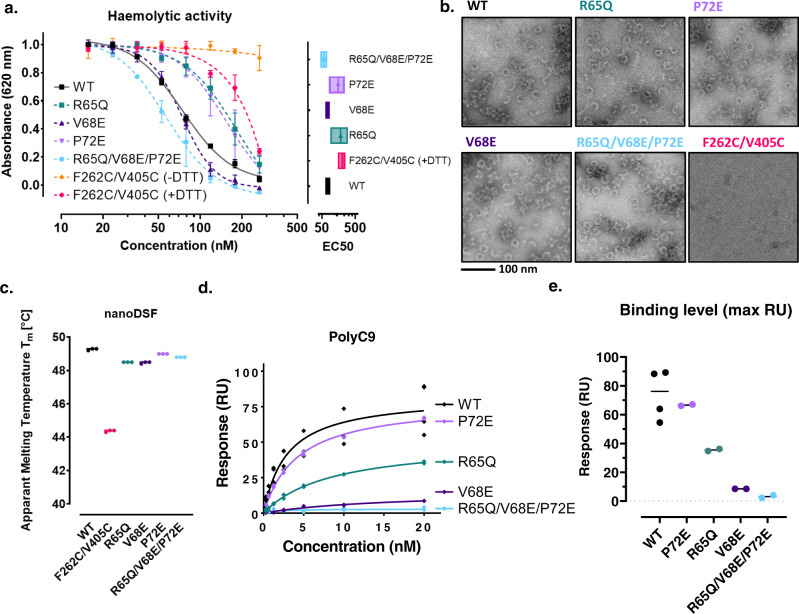
Fig. 3. Characterisation of the C9 neoepitope by site-directed mutagenesis and SPR.
a Concentration series and effective half-maximal concentration of MAC haemolytic assay with C9 variants (n = 3; mean and standard error of the mean [SEM] are plotted). b Negative-staining electron microscopy of polyC9 variants. c Nano-differential scanning fluorimetry measurements of apparent thermal stability. d Maximal SPR response of aE11 IgG binding versus concentration of polyC9 and variants (n = 2). e Maximal binding of aE11 IgG (arbitrary response units) at 20 nM of polyC9 and variants (n = 2). Individual data points and their means are plotted.

