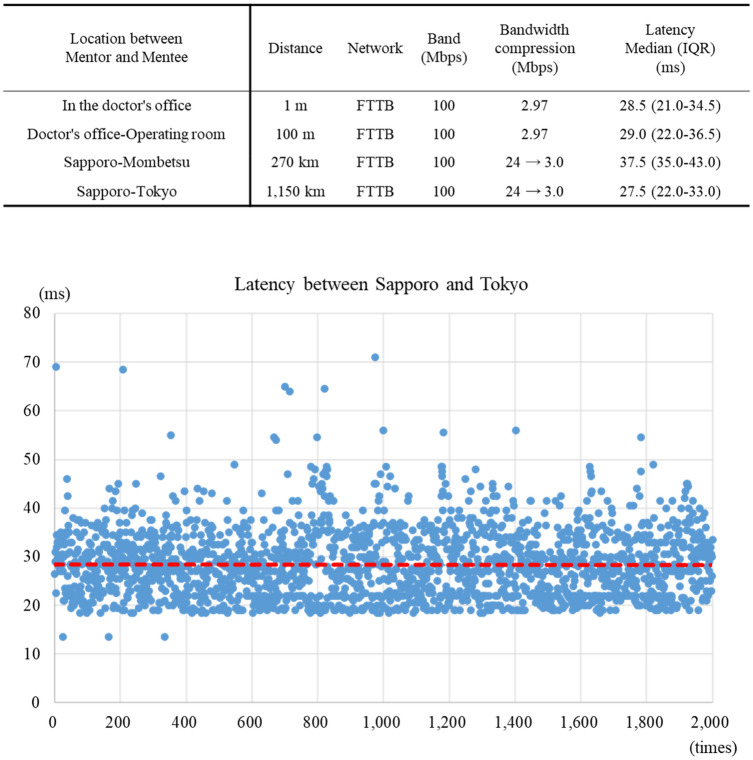
Fig. 2.
Scatter plot of the latency time between Sapporo and Tokyo. The latency was measured using 2000 annotations from a monitor in Sapporo. The median latency was 27.5 ms (red dashed line). Vertical axis: Latency (ms); Horizontal axis: Annotation number (times). FTTB Fiber to the building, IQR Interquartile Range

