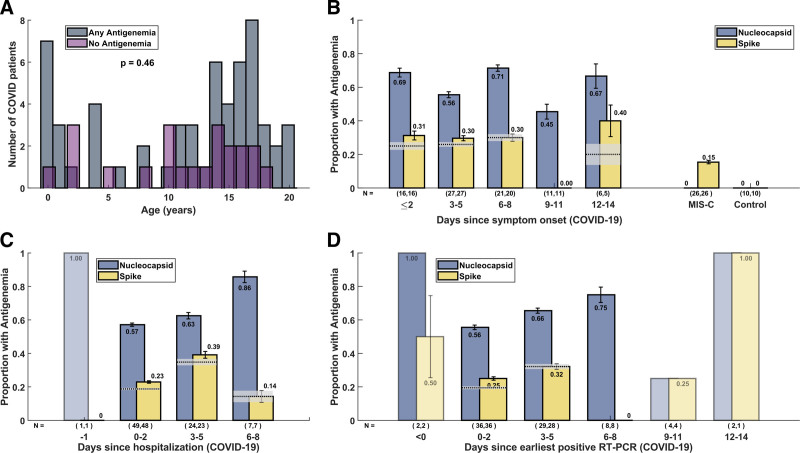
FIGURE 1.
Characteristics of COVID-19 patients and timing of blood sampling. (A) Histogram of ages of COVID-19 patients with and without antigenemia. The distribution of ages between these two groups was not significantly different by rank-sum test (P = 0.46). Panels B-D demonstrate the proportion and 95% CIs of COVID-19 patients with nucleocapsid or spike antigenemia stratified by time of blood sample collection with respect to (B) symptom onset, (C) hospital admission, and (D) earliest positive SARS-CoV-2 RT-PCR. MIS-C and control measurements are depicted in panel B for comparison. The proportion of patients with concurrent nucleocapsid and spike antigenemia is demonstrated with a dotted horizontal line (proportion) and gray box (95% CI). For groups with N < 5 CIs were not calculated and faded bars are displayed.

