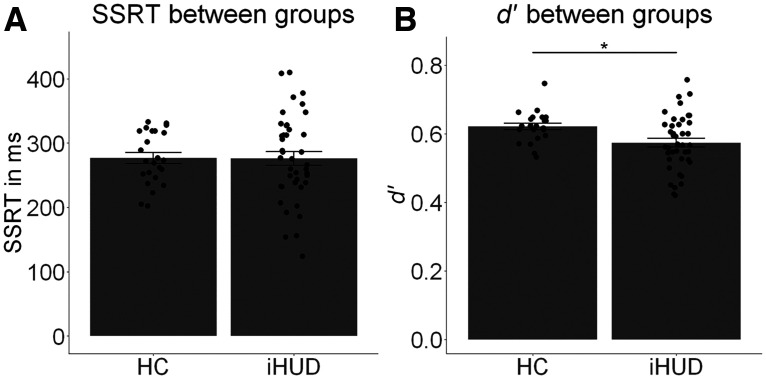
Figure 2.
Stop-signal task performance. A, B, iHUD and HC participants' (A) SSRT (the classic inhibitory control measure of stopping latency), indicating no significant group differences (p = 0.960) and (B) target detection sensitivity (d′), indicating significantly lower d′ in iHUDs compared with HCs (p = 0.003). Swarm plots indicate individual data points. Error bars indicate SEM. No data points were 3 SDs above or below the mean. Significant group difference flagged with an asterisk.

