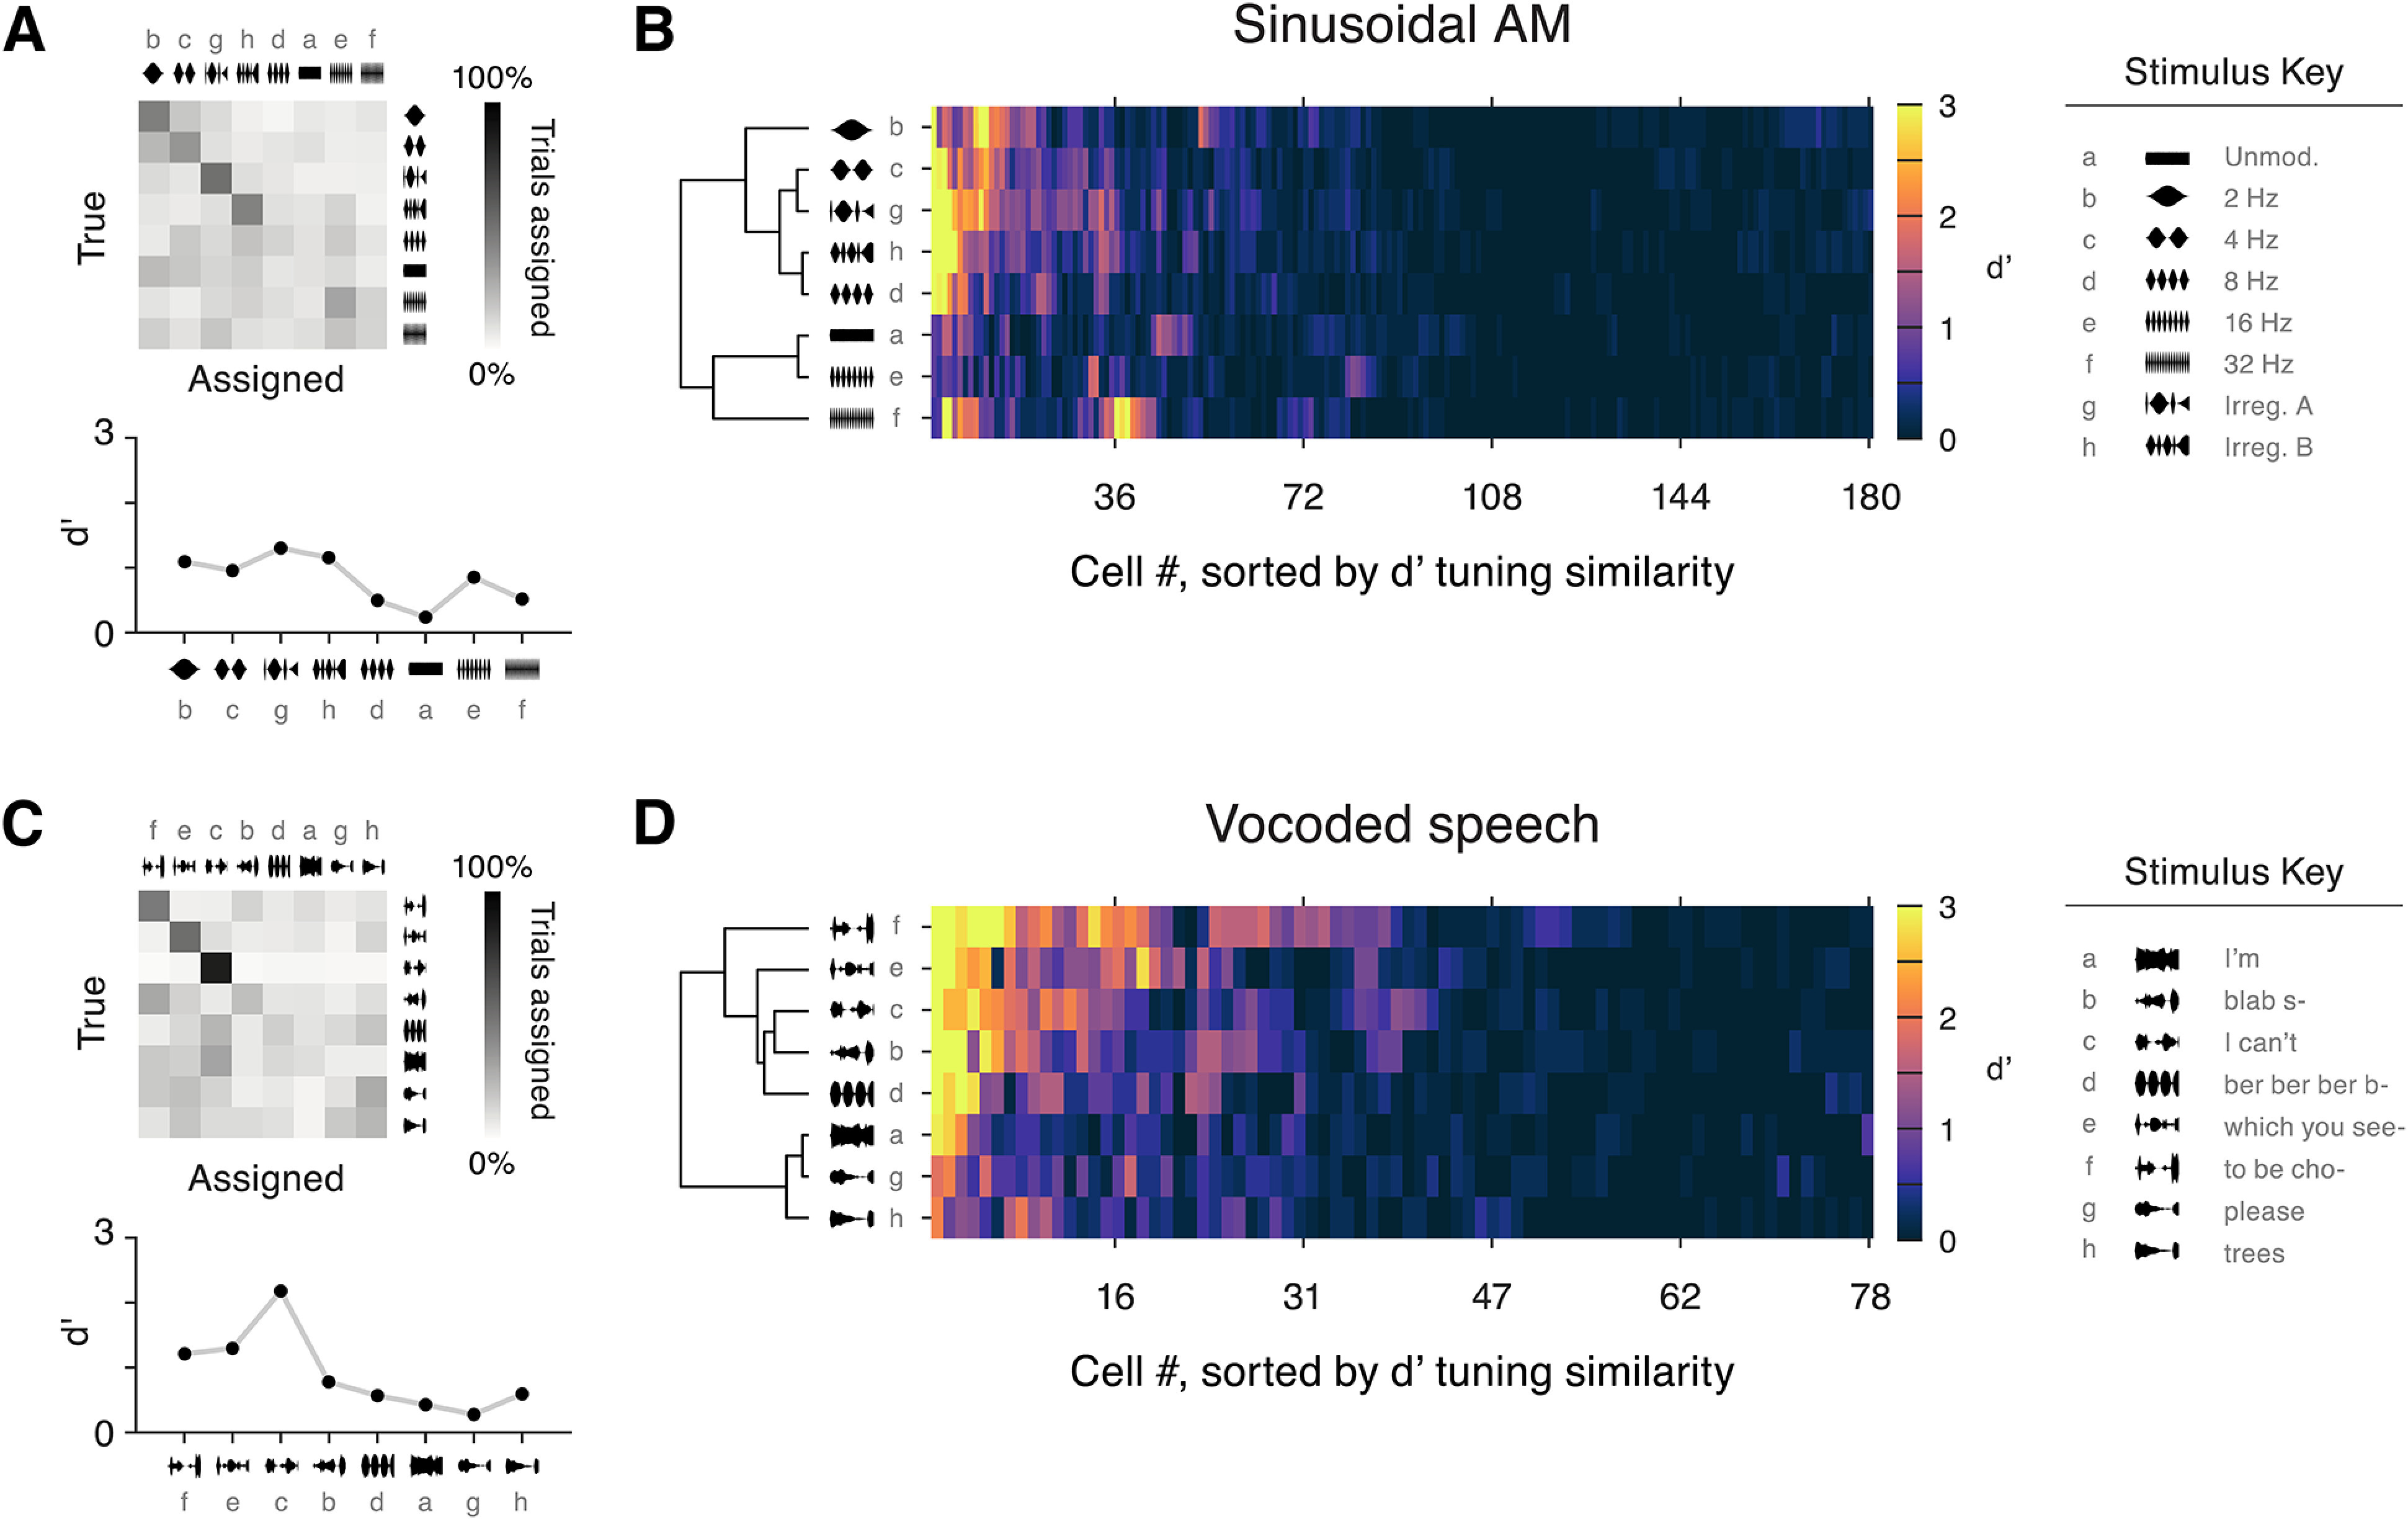
Figure 10.

Poor envelope classification by individual neurons. A, A confusion matrix displays the results of the single-trial SVM classification procedure for an example cell in the sinusoidal AM condition (same cell as Fig. 3A). A d′ value was calculated for each stimulus and is plotted below. Note that the order of stimulus tokens is different from prior figures; see stimulus key on far right. B, d′ values across stimuli for all RS cells. Cells were sorted according to similarity of their d′ vectors using a hierarchical clustering algorithm. The same clustering approach was independently applied to sort stimulus tokens according to similarity of population representation. Overall, 9% of cell/stimulus pairs had classification levels of d′ > 1. C, Results from the vocoded speech classification task are shown for an example cell (same as Fig. 6A). Below, d′ is shown for each stimulus. D, d′ values across stimuli for all RS cells. Cells and stimuli were hierarchically clustered as above; 18% of cell/stimulus pairs had d′ > 1.
