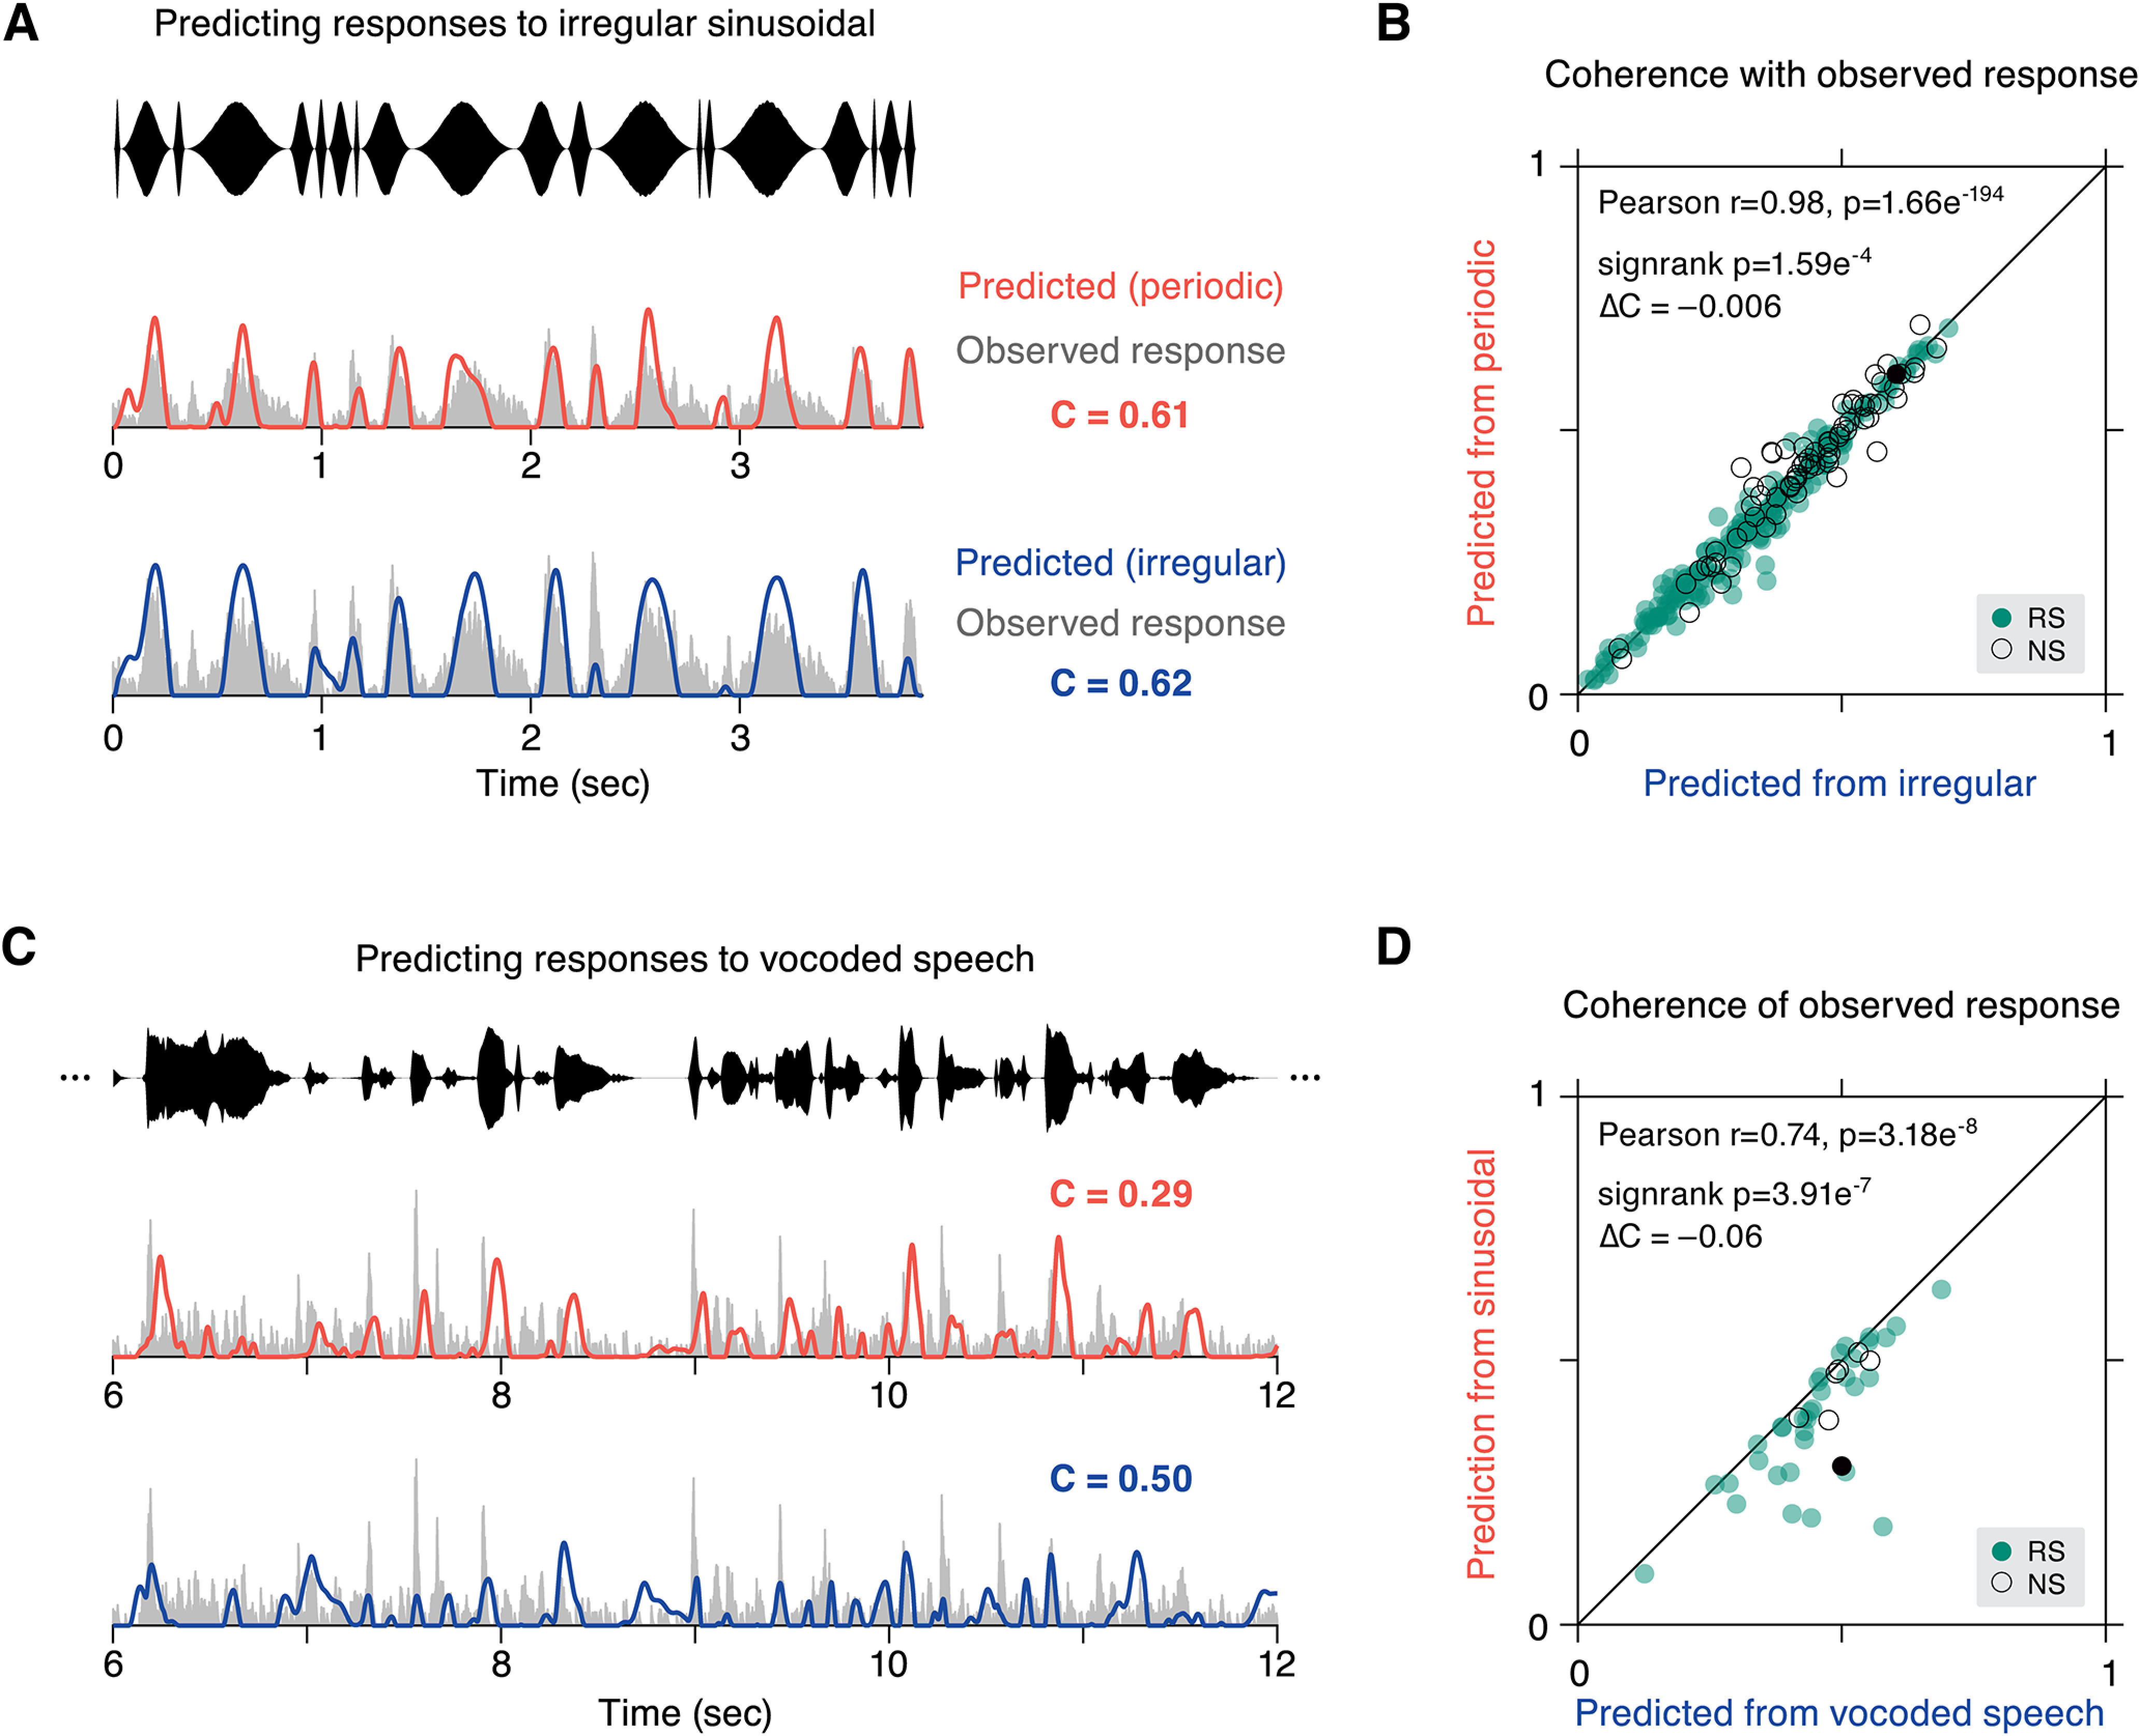
Figure 7.

Nonlinearity in responses from local features of modulation stimuli. A, Two predictions for the response to irregular modulation were created, one from a linear kernel generated from periodic data, and the other from a kernel based on held out trials of irregular data. The quality of each prediction was quantified by a coincidence value (C). Predicted (orange) and observed (gray) responses are plotted for an example cell for periodic training data and irregular training data (blue). B, Coincidence values for each cell of observed responses with responses of the same stimulus (irregular data, abscissa) are shown against coincidence values obtained from the kernel constructed from the opposite stimulus type (periodic data, ordinate). Overall, linear predictions are similar for either context (Pearson's r = 0.98, p = 1.66e−194), although same context predictions are slightly higher (ΔCPdc-Irr = –0.006, p = 1.59e−4 sign-rank). C, The ability of sinusoidal data to predict vocoded speech responses was compared with predictions generated from separate trials of vocoded speech. Predicted activity for an example cell is shown for the opposite stimulus type (irregular sinusoidal, orange) and same stimulus (vocoded speech, blue). D, Coincidence values are plotted for all cells that were recorded in both stimulus conditions (N = 41), with predictions from the same stimulus type (vocoded speech, abscissa) and the opposite stimulus type (irregular sinusoidal, ordinate). Again, coincidence values are strongly correlated across stimulus types (Pearson's r = 0.74, p = 3.18e−8), but same context prediction is better (ΔCSin-Speech = –0.06, p = 3.91e−7 sign-rank). Colors in panels B, D: RS cells are filled green and NS are outlined black. Example cells from A, C are highlighted as filled black circles.
