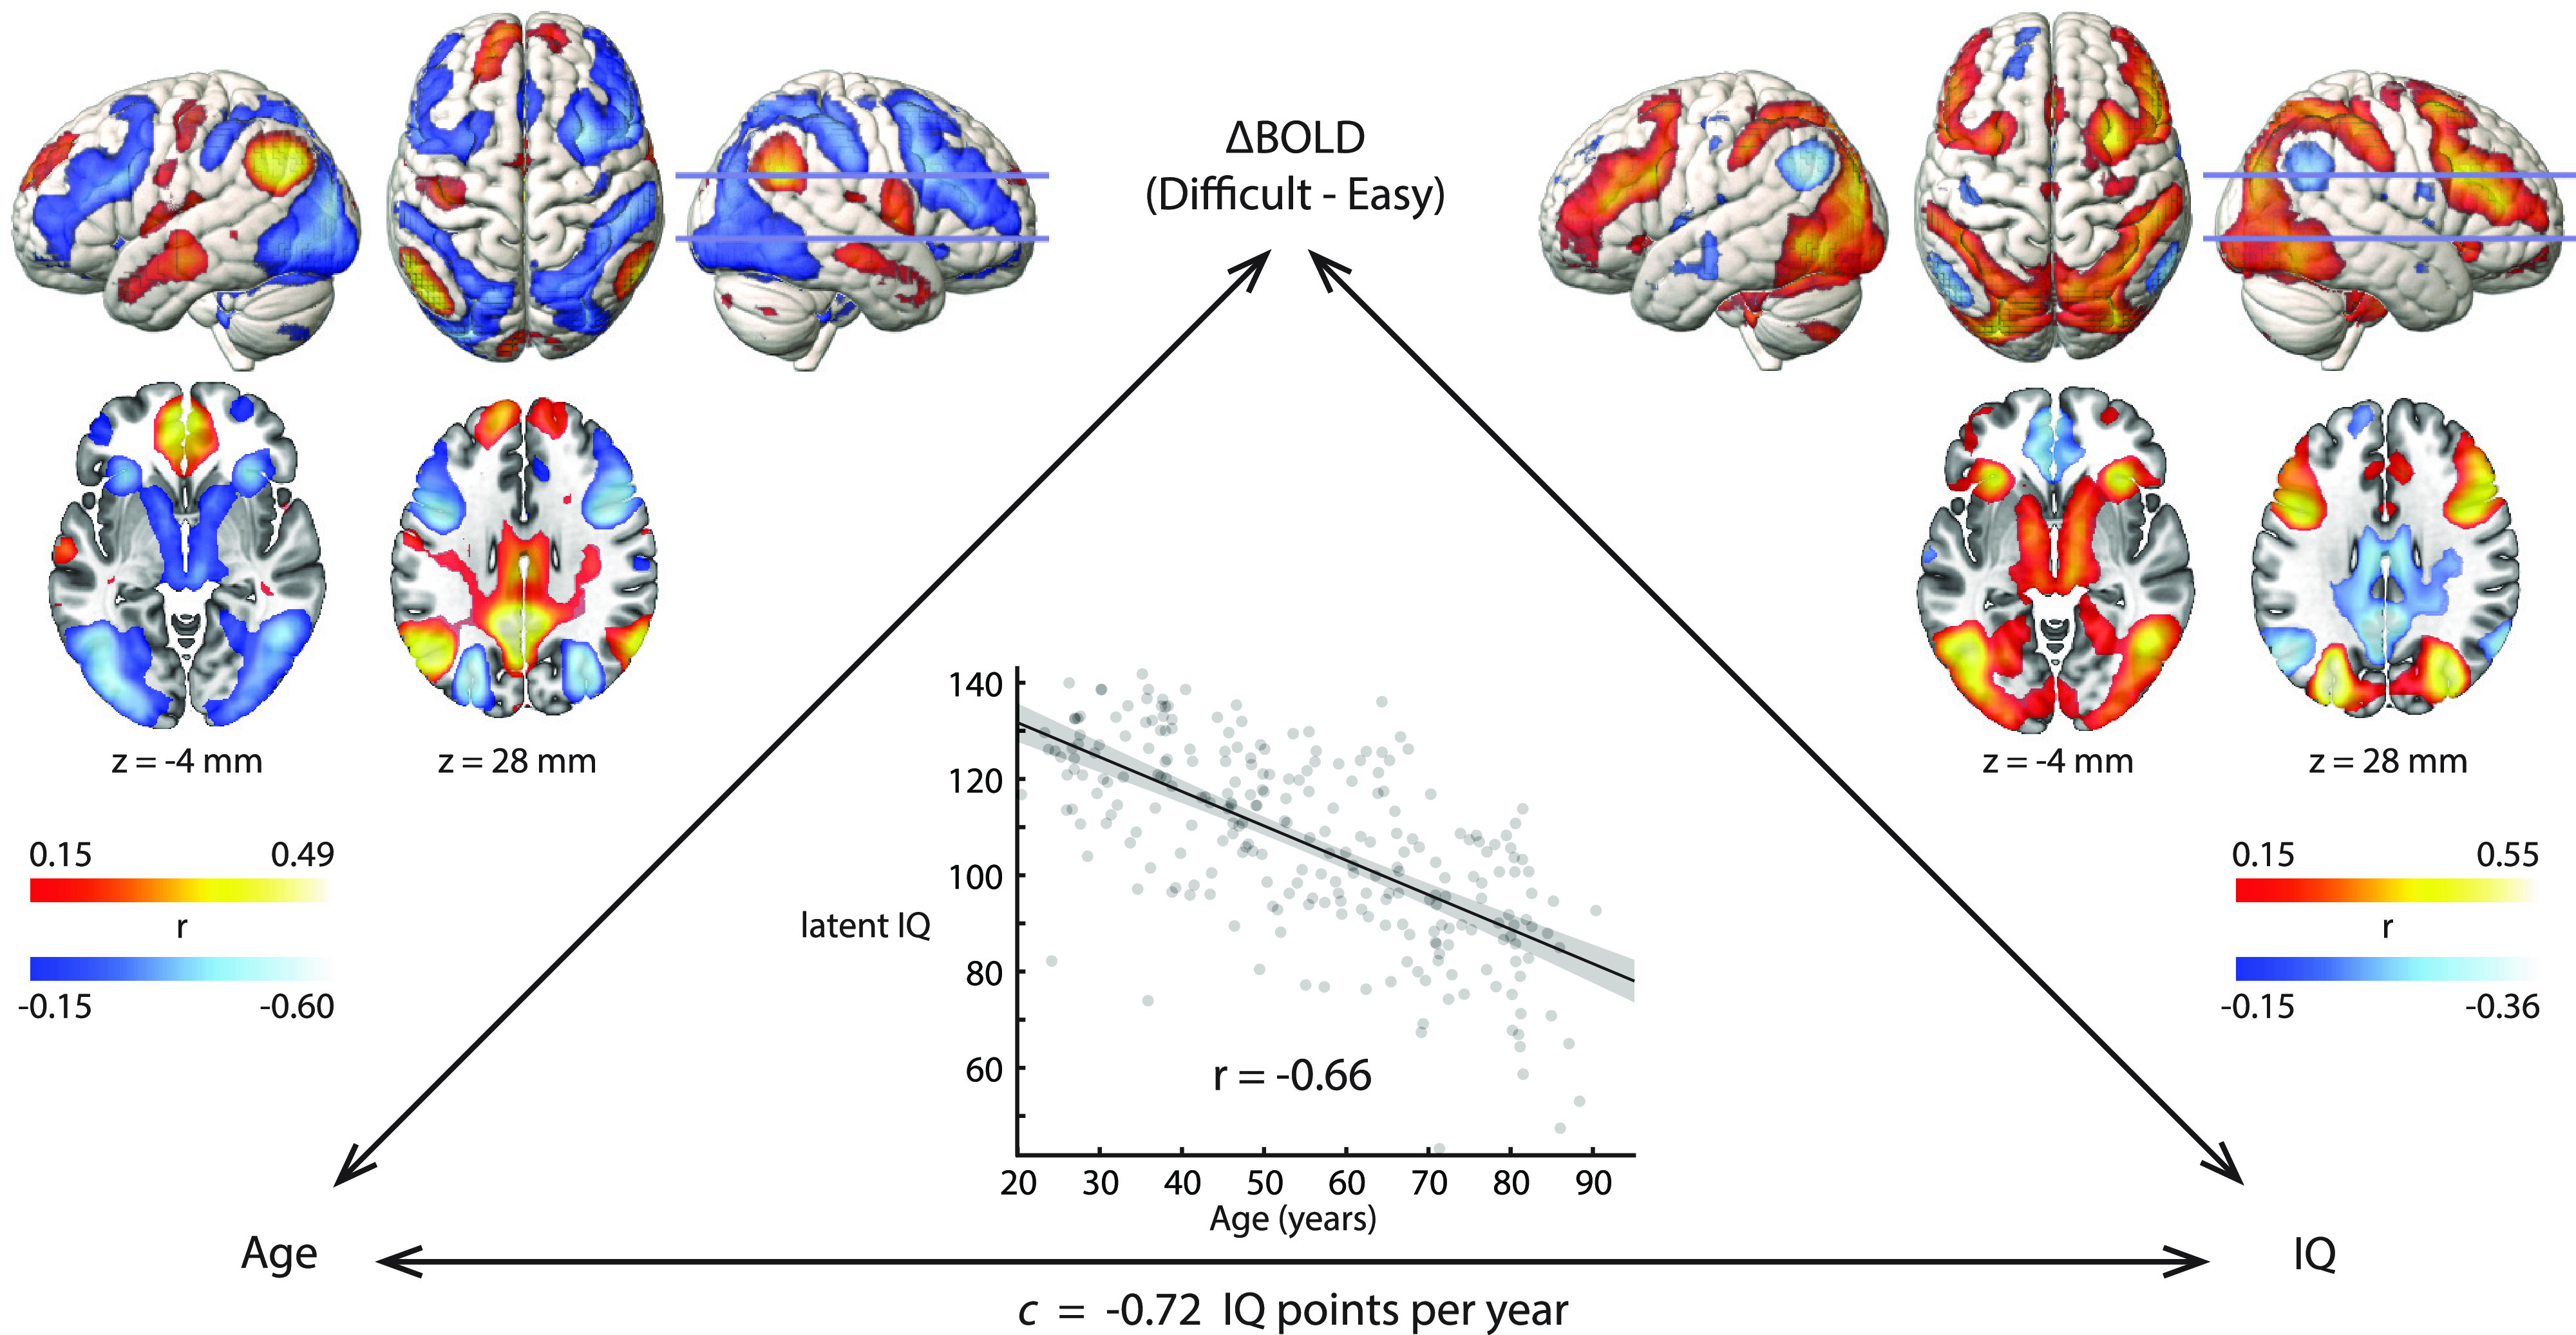
Figure 2.

Bivariate relationships between age, fMRI response, and fluid intelligence (N = 252). Voxel-wise correlation coefficients are thresholded based on significance at FDR < 0.05. Slice positions are labeled in MNI coordinates and marked on the right hemisphere rendering. Surface renderings show activations to a depth of 15 mm. The gray band in the scatter plot represents the 95% CI of the fitted line.
