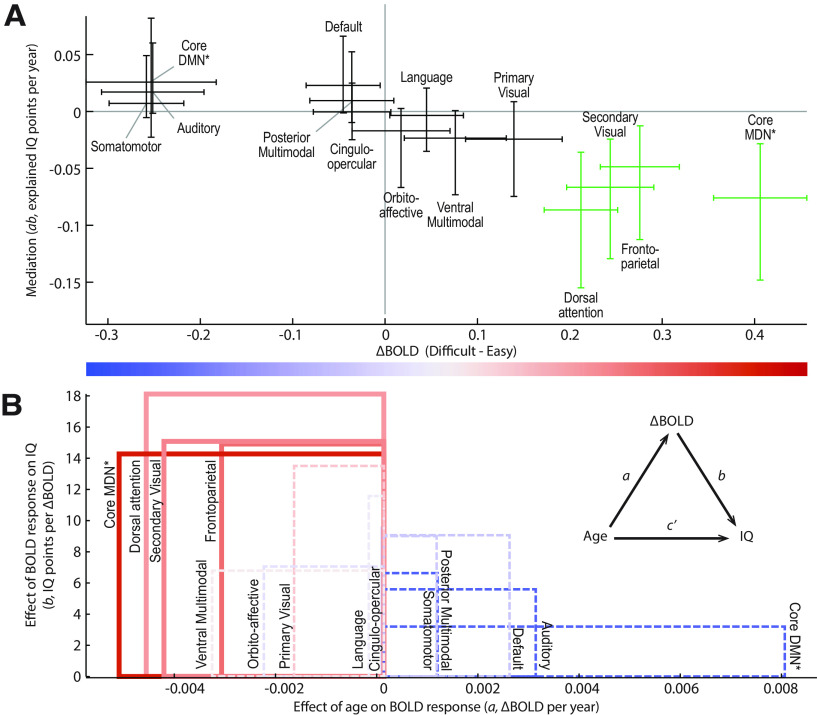
Figure 3.
BOLD response to cognitive difficulty, and its mediation of age effects on fluid intelligence, for cortical network ROIs (N = 154). A, Overall mediation effect size versus group average BOLD response. Error bars are 95% CIs derived from the associated t test (BOLD contrast) or bias-corrected bootstrap (mediation). Green represents networks with significant mediation after FDR correction (adjusted p < 0.05). B, The b coefficient (reflecting the age-adjusted effect of the BOLD response on IQ) is plotted versus the a coefficient (reflecting the effect of age on the BOLD response), with group-mean BOLD response represented by color. Inset, Mediation model. The area of each rectangle conveys the mediation effect size (ab) for the corresponding network. Solid and dashed lines indicate significant and nonsignificant mediation, respectively. Asterisks indicate networks defined from their conjunction response to easy/difficult conditions using data from three Human Connectome Project tasks as presented in Assem et al. (2020a); remaining networks are defined from functional connectivity as presented in Ji et al. (2019).

