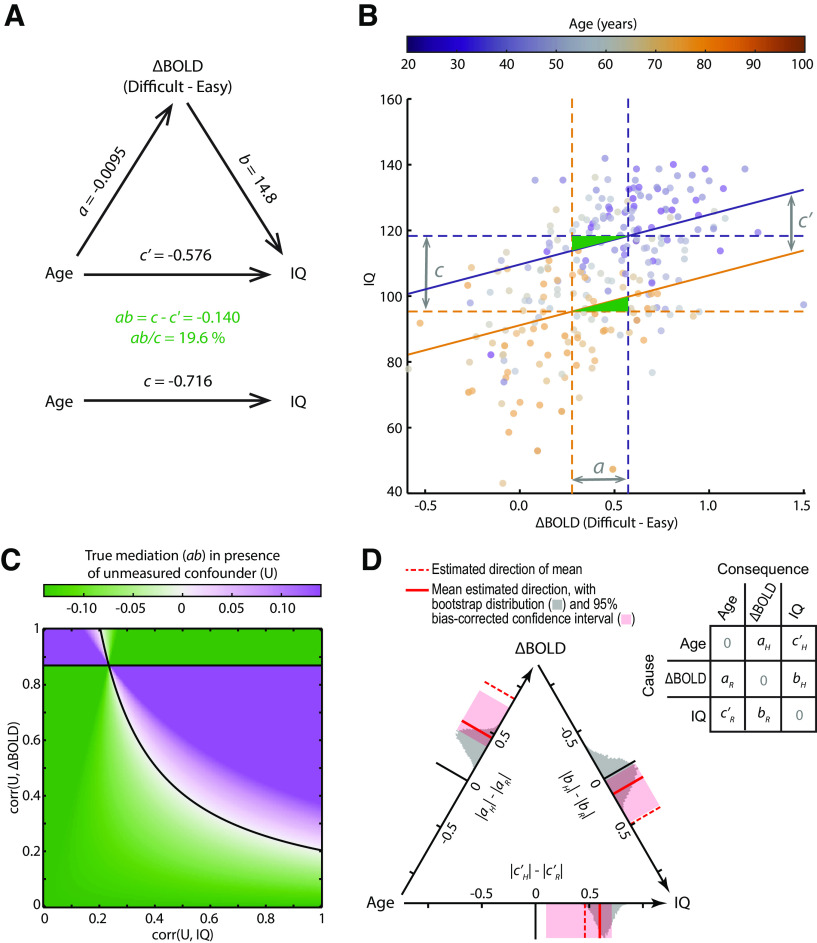
Figure 5.
Summary and assessment of the localized mediation effect, averaged across voxels where mediation is significant, data are available from all participants (N = 252), and the difficult–easy contrast is positive. A, Fitted mediation model. B, Illustration of the mediation effect and underlying relationships. Vertical dashed lines indicate Equation 3 at the first and third quartiles of the age distribution (purple represents 39 years; orange represents 71 years). Horizontal dashed lines indicate Equation 1 at the same ages. Solid lines indicate Equation 2 at the same ages, with their slope equal to coefficient b. Gray arrows indicate coefficients a, c, and c′, when age is scaled by the interquartile range. Green triangles represent the standardized mediation effect size, relative to the area of the central rectangle, which can be seen to account for approximately one-fifth of the total effect. C, Left Out Variables Error (LOVE) plot indicating how large any correlations with an unmodeled confounder (U) would need to be to reduce the true mediation to zero. The observed mediation effect size lies at the origin. D, Estimated causal direction of each path, using ICA-LiNGAM after standardization of variables (see Materials and Methods). Axes represent the difference of absolute model coefficients for the hypothesized (H) minus reverse (R) causal directions, indicated by the matrix. Estimation of the model returns three non-zero coefficients in this matrix, one for each pair of variables, in either of the two possible directions. (Zeros on the diagonal reflect the fact that variables are assumed not to cause themselves.) Dashed red lines were calculated using the mean signal across all mediating voxels as plotted in B. Solid red lines indicate mean direction estimates, averaged across local clusters of mediating voxels whose undirected coefficient signs matched those from the mean signal. Gray histograms represent the bootstrap sampling distribution of the cluster-mean directionality. Pink bands represent bootstrapped 95% bias-corrected percentile CIs for the cluster-mean directionality.

