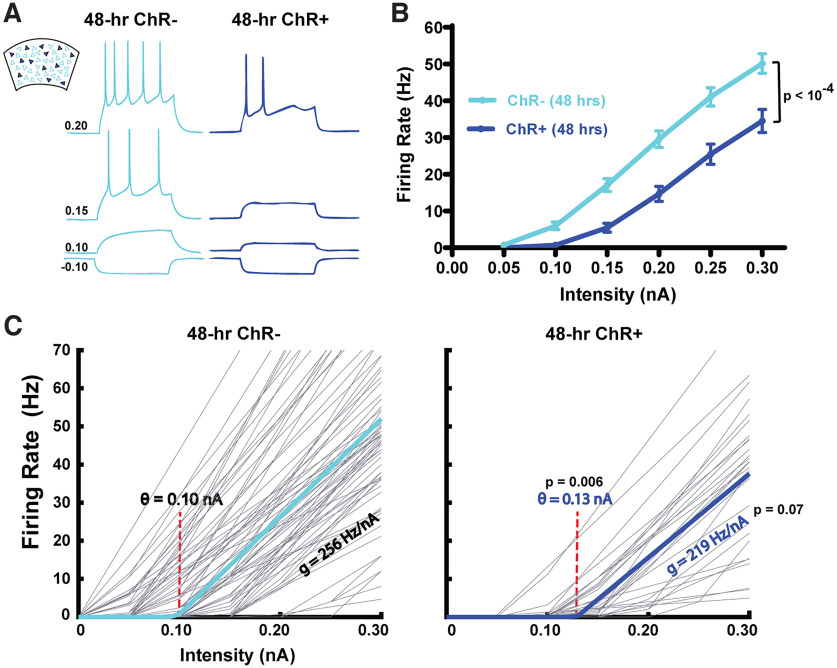
Figure 3.
Cell-autonomous decreases in the intrinsic input–output function of ChR+ compared with ChR– pyramidal neurons in sparsely transduced slices. A, Sample intrinsic excitability traces simultaneously recorded from ChR– and ChR+ pyramidal neurons from sparsely transduced cortical circuits stimulated for 48 h (250 ms current steps ranged from −0.10 to 0.3 nA). B, F-I curves of the average input–output functions from ChR– and ChR+ pyramidal neurons from sparsely transduced cortical slices stimulated for 48 h. C, Threshold-linear fits of the F-I curves of the ChR– and ChR+ populations. Light gray lines indicate the fits of the F-I curves of individual neurons. Solid cyan or blue lines indicate the mean threshold-linear fit. The threshold (θ = 0.10 nA) of the ChR– Pyr neurons was significantly lower than the ChR+ Pyr neurons (θ = 0.13 nA).

