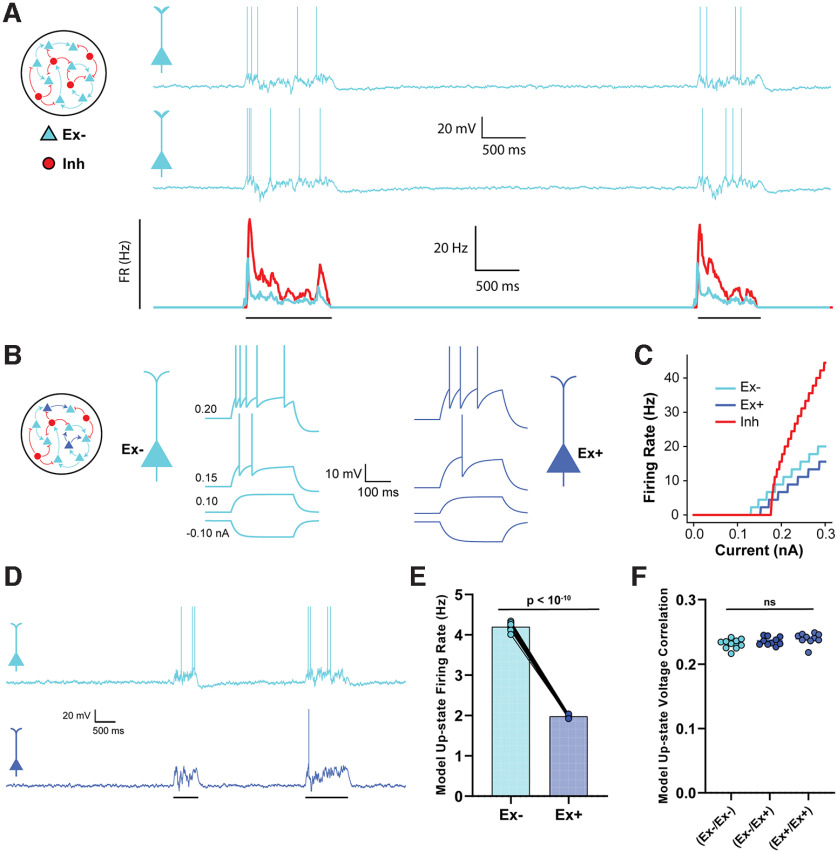
Figure 5.
Empirically observed changes in intrinsic excitability is sufficient to account for cluster-specific changes in firing rate. A, The neural network model was composed of 2000 adaptive integrate-and-fire units (1600 Ex, 400 Inh). Traces represent two example Up-states in two sample Ex units in the baseline model. Average firing rate of all excitatory and inhibitory neurons during an Up-state is shown below. B, In the experimental network, there were two populations of Ex units (Ex+ and Ex–) with different intrinsic excitability. Spike threshold, leak conductance, and membrane capacitance parameters differed between the Ex– and Ex+ units. Traces represent the response to 250 ms square waves of injected current. C, F-I curves comparing the spiking output of the Ex+, Ex–, and Inh units. The difference in spike threshold and slope for the Ex– and Ex+ units qualitatively match empirical findings. D, Sample Up-states in the experimental neural network. E, Average firing rates of Ex– and Ex+ units during Up-states were significantly different. F, The mean pairwise correlations between the Ex–/Ex–, Ex–/Ex+, and Ex+/Ex+ pairs were not significantly different (data from 10 simulations).

