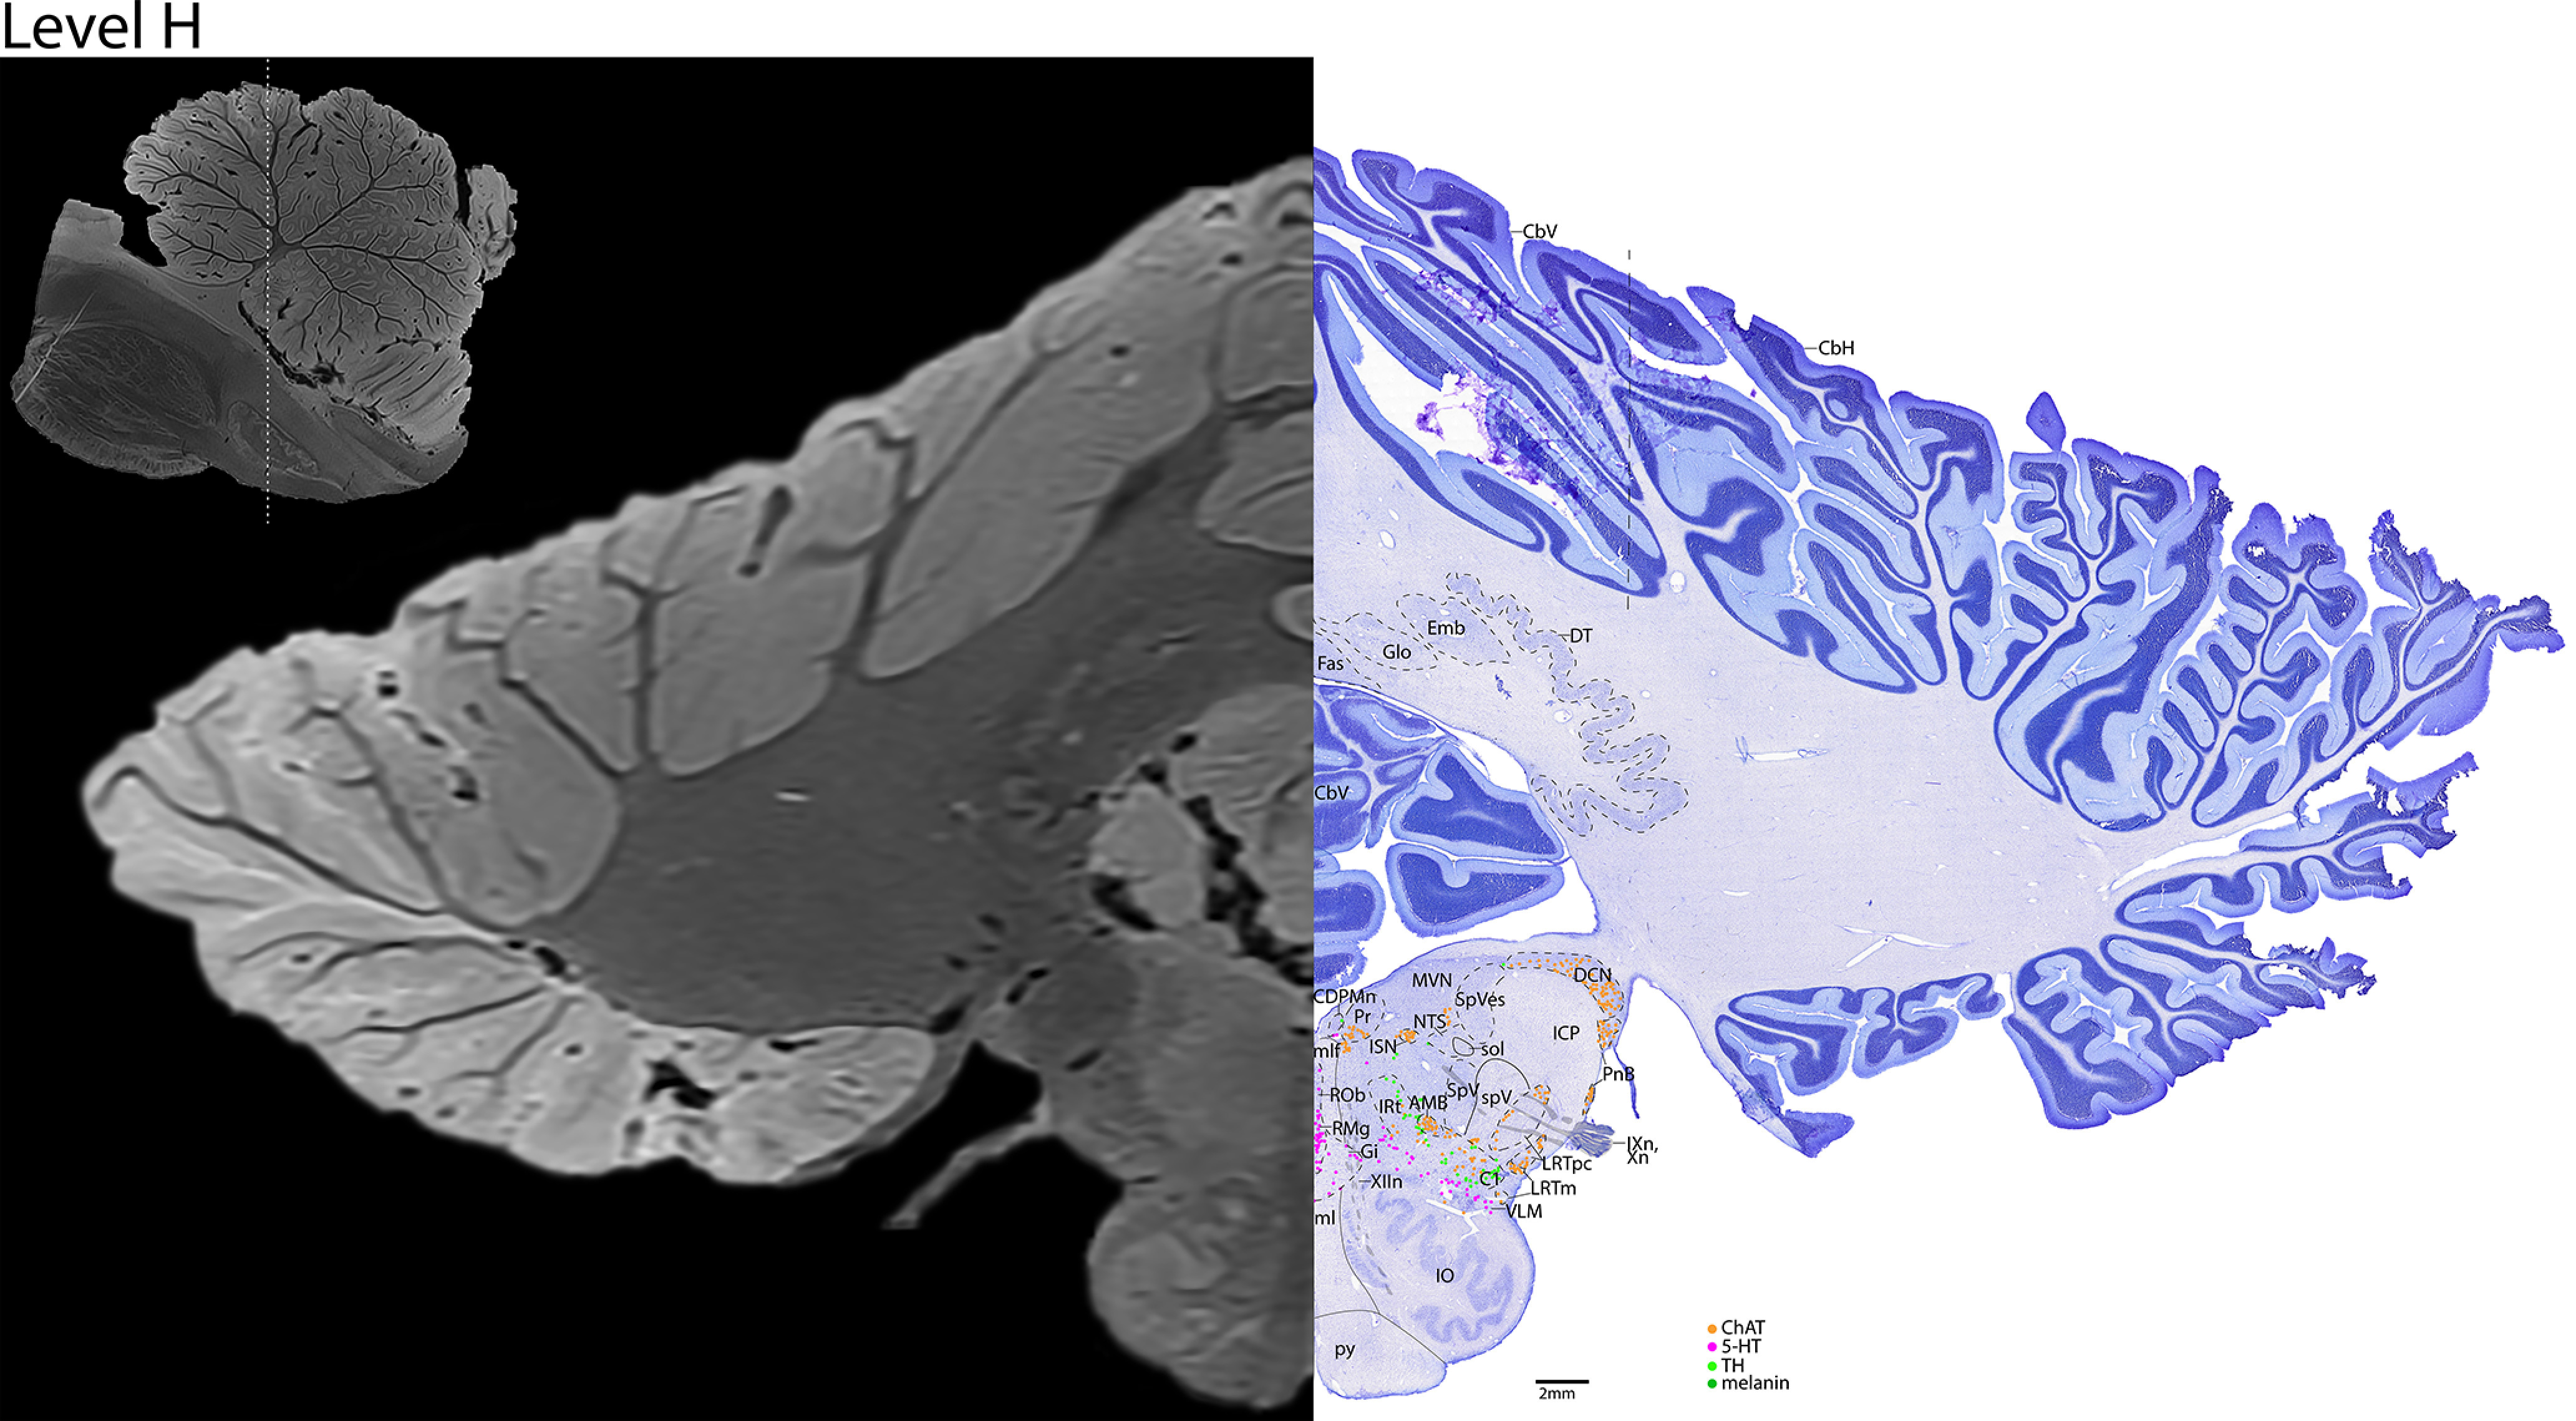
Figure 20.

The rostral medulla. Level H is comprised of MRI image on left and Nissl stain on right. Dots represent different cell types (orange represents ChAT; pink represents TpOH; bright green represents TH; dark green represents melanin-pigmented). Dashed line through sagittal section indicates the rostrocaudal level.
