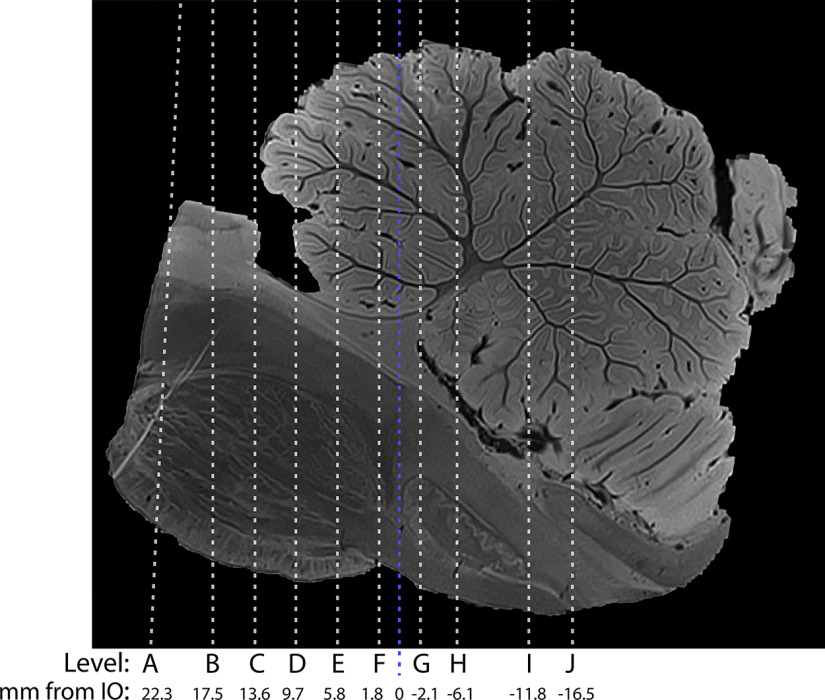
Figure 5.
Sagittal MRI image demonstrating the location of each histologic level, and their distances from the anterior inferior olive (blue line). Level A is referenced in Figures 6 and 7. Level B is referenced in Figures 8 and 9. Level C is referenced in Figures 2, 10, and 11. Level D is referenced in Figures 12 and 13. Level E is referenced in Figures 14 and 15. Level F is referenced in Figures 16 and 17. Level G is referenced in Figures 3, 18, and 19. Level H is referenced in Figures 20 and 21. Level I is referenced in Figures 4, 22, and 23. Level J is referenced in Figures 24 and 25.

