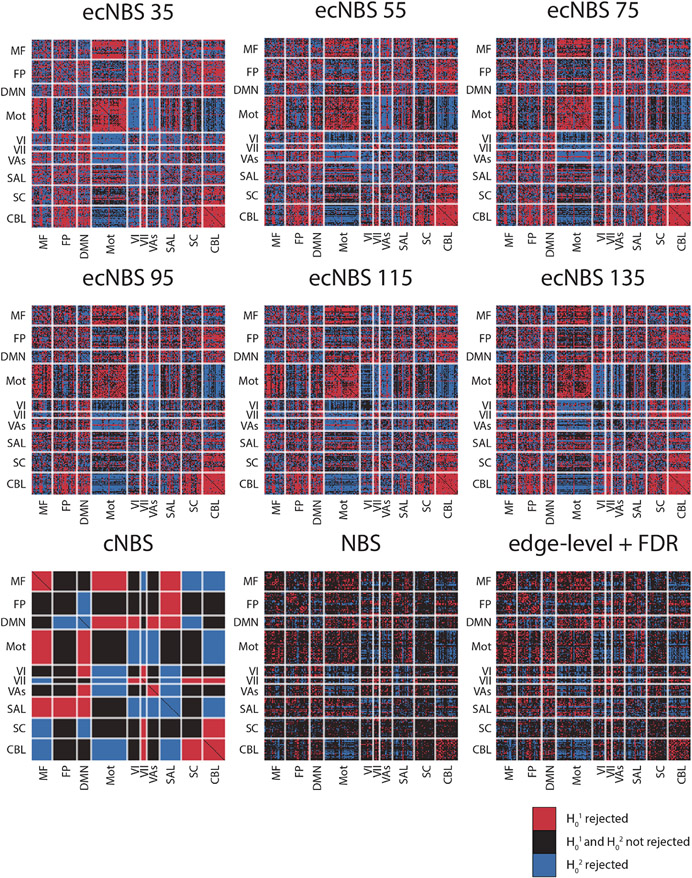
Fig. 5.
Detections on the full sample of HCP sex data with a two-tailed t-test. Each matrix reflects the results performed with different inferential methods with the labels reflecting which method was used. Shown here are component-wise rejections of the null hypotheses. Red indicates that the null hypothesis that the component is not greater in males than in females (H01) was rejected with α = 0.025. Blue indicates that the null hypothesis that the component is not greater in females than in males (H02) was rejected with α = 0.025. Black indicates that neither null hypothesis was rejected.

