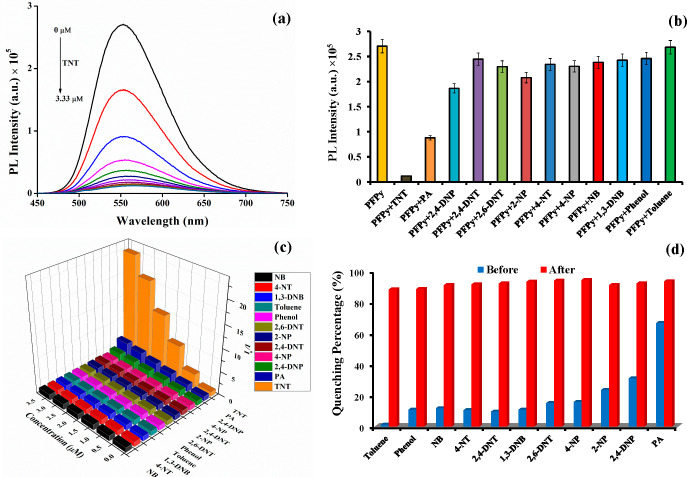
Figure 1.
(a) PL spectra of PFPy (6.66 μM) at different concentration of TNT in water containing 10 mM NaOH. (b) Effect of various NACs (3.33 μM) on the PFPy (6.66 μM) intensity. (c) S–V plots (3D) obtained for various NACs. (d) Quenching (%) by various NACs (3.33 μM) before (blue) and after (red) addition of TNT (3.33 μM).

