Figure 2.
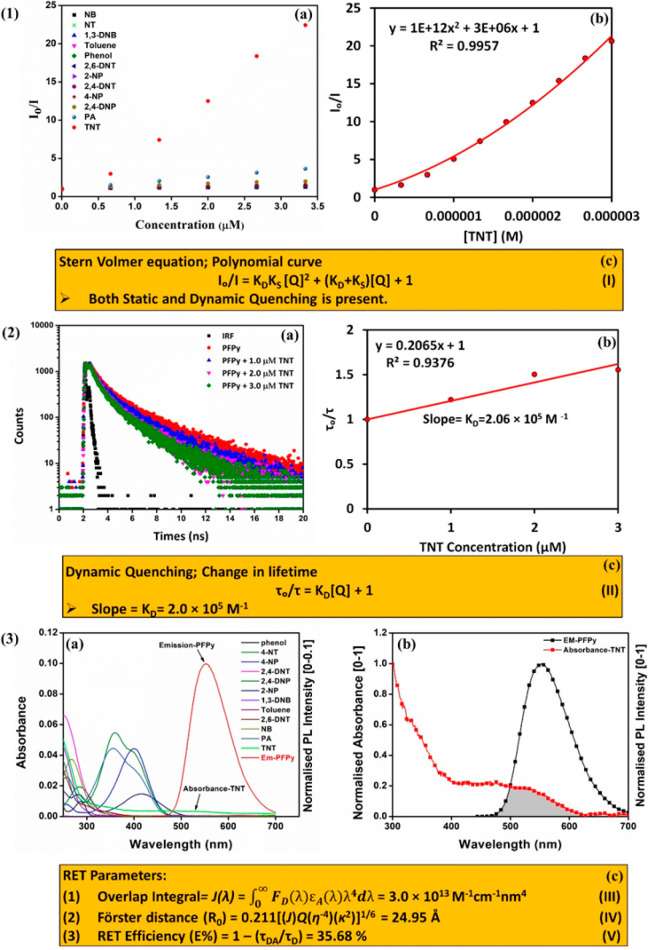
(1) Stern–Volmer (S–V) plot (2D) obtained for (a) all NACs and (b) second-order polynomial fitting of S–V plot for TNT. (c) S–V equation for both static and dynamic quenching. (2) (a) Time-resolved photoluminescence (TRPL) spectra of PFPy (6.66 μM) in the absence and presence of various concentration of TNT in water containing 10 mM NaOH. (b) Change in lifetime at various concentrations of TNT. (c) Equation (II) for dynamic quenching: where τ and τo are the average fluorescence lifetime with and without TNT, respectively. (3) (a) Spectral overlap between the normalized PL spectrum [0–0.1] of CP PFPy with absorbance of various NACs in water containing 10 mM NaOH. (b) Spectral overlapping region between the normalized emission spectrum of PFPy with TNT in water containing 10 mM NaOH. (c) Equations for RET parameters: (1) Equation (III)-where J denotes overlap integral value, FD(λ) represents the corrected fluorescence intensity from λ to Δλ with total fluorescence intensity for PFPy normalized to 1, and εA represents molar absorptivity of acceptor in M–1 cm–1. (2) Equation (IV)-where R0 represents Förster distance, Q denotes the fluoresence quantum yield of PFPy, η represents refractive index of the medium, and k2 signifies dipole orientation factor (0.667). (3) Equation (V)-where E% denotes RET efficiency, τDA and τD are the average fluorescence lifetime with and without quencher, i.e., TNT.

