
FIGURE 2.
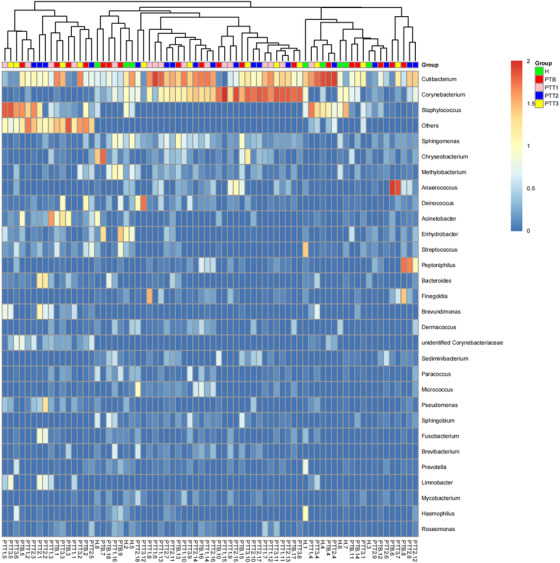
Heatmap revealed the top 30 skin microflora of patients and healthy individuals in the genus level. The horizontal coordinate is sample; the vertical coordinate is genus. The colors range from red to blue refers that the log10 value of the relative abundance of different isolates in different samples is from 2 to 0. (H group [green], healthy control; PTB group [red], pre photodynamic therapy; PTT1 group [pink], the first photodynamic therapy group; PTT2 group [blue], the second photodynamic therapy group; PTT3 group [yellow], the third photodynamic therapy group)