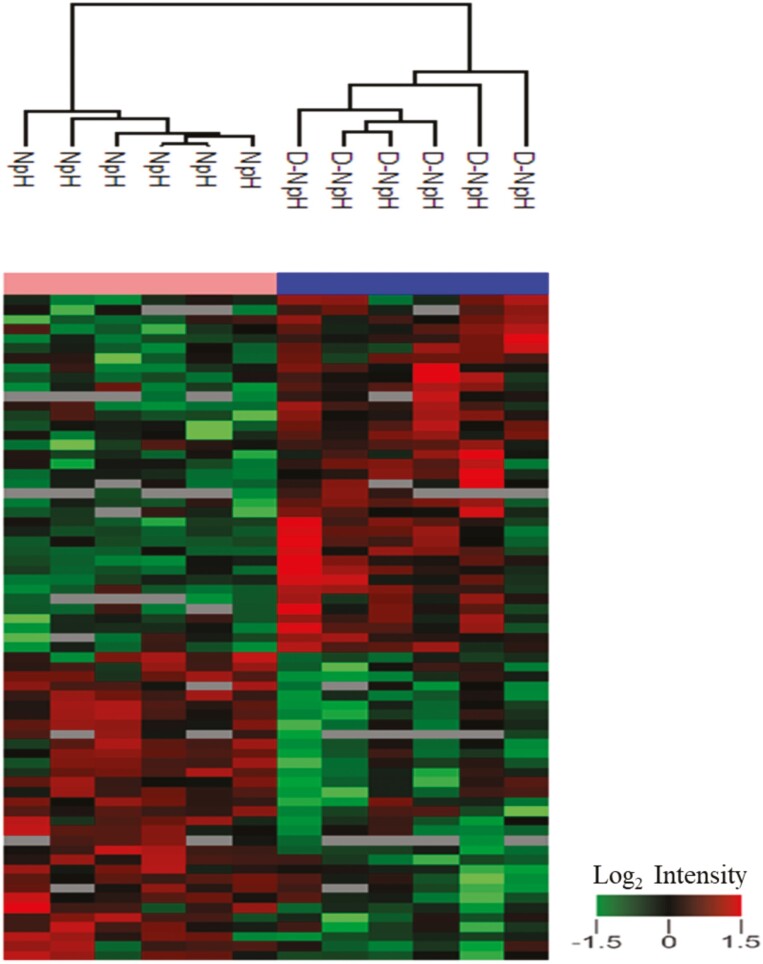
Figure 2.
Hierarchical clustering analysis of protein abundance profiles in dark-colored beef at slightly elevated pH vs. normal-pH beef. The changes in protein abundance profiles of dark-colored beef at slightly elevated pH vs. normal-pH beef were quantified as described in the “materials and method” section. Red and green colors represent overabundant and less abundant proteins in dark-colored beef at slightly elevated pH compared with normal-pH beef. Heat map color legend represents the log2 transformed ratio of dark-colored beef at slightly elevated pH vs. normal-pH beef.

