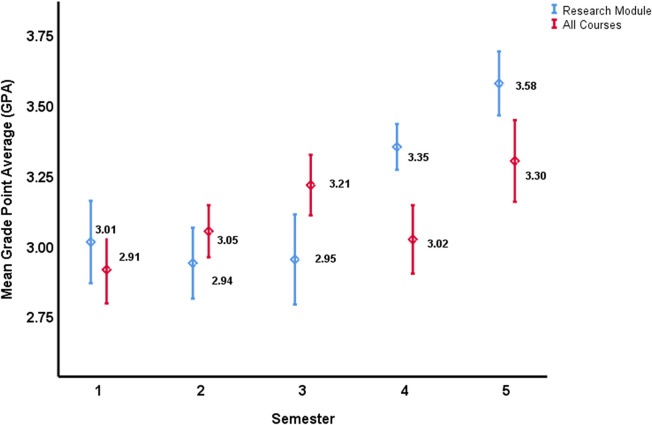
Fig 2. Mean Grade Point Average (GPA), with the corresponding 95% Confidence Interval (CI), for the research module courses (Blue), and all the MBBS program courses together (Red), offered in the respective semester.
Blue lines- There are two distinct clusters of mean GPA values across the 5-integrated course modules: first cluster was for courses of semesters 1, 2, and 3, and the second cluster was for courses of semesters 4 and 5. The 95% CI for Semester 1, 2, and 3 overlap indicating no statistical difference between the three research courses given in the first 3 semesters. Similarly, the 95% CI for the research courses given in Semester 4 and 5 overlap indicating no statistical difference (p>0.05). However, post-hoc ANOVA analysis revealed two distinct clusters of mean GPA, the first cluster (Semesters 1, 2, and 3) and the second cluster (Semesters 4 and 5) (p<0.01).

