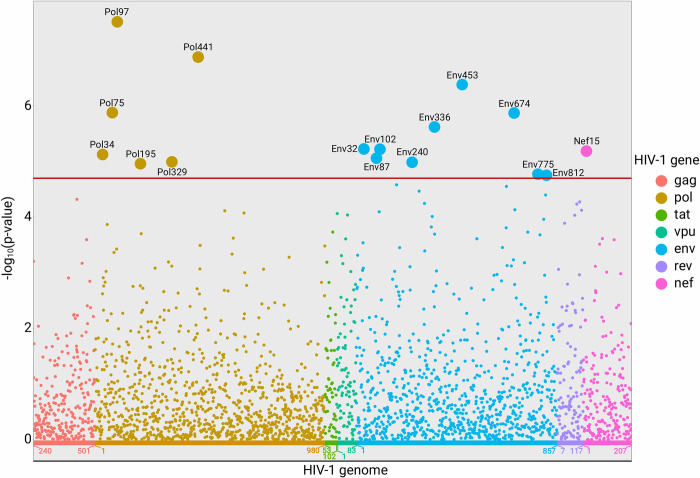
Fig 3. Manhattan plot of the associations between viral load (VL) and Shannon entropy at AA positions projected on the HIV genome.
Red horizontal line marks the Bonferroni p-value threshold (p = 2.0×10⁻⁵). The x-axis denotes gene AA positions. A total of 2,447 HIV AA positions are shown on the x-axis. Gag positions 1–239, Pol positions 981–1004, Rev positions 1–6 and Tat positions 1–51 are not shown, as they were not covered by the amplicons.

