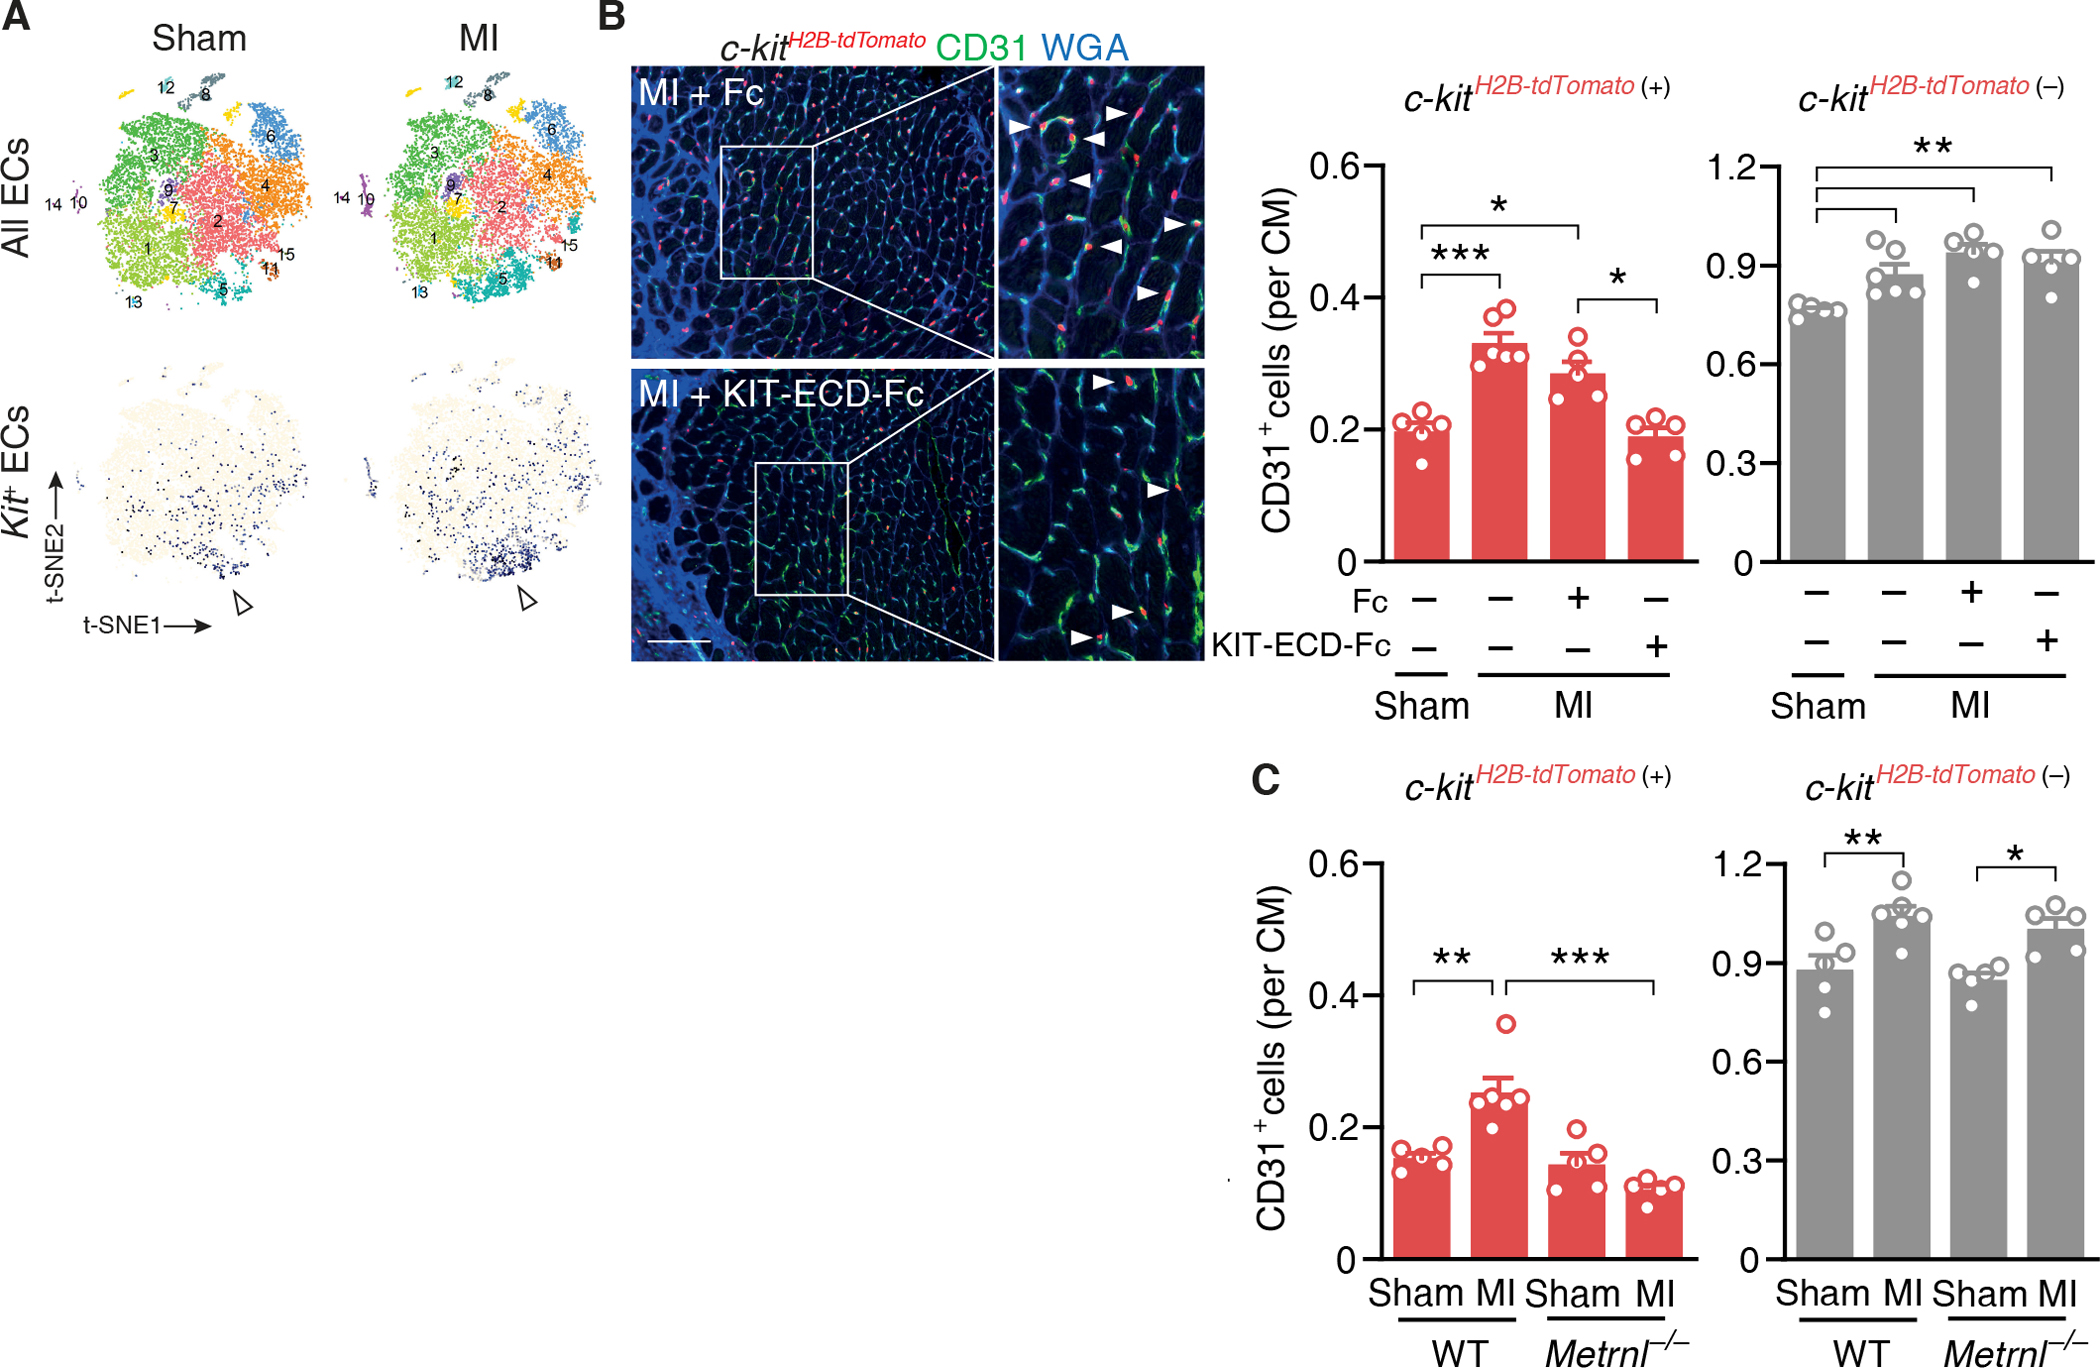
Fig. 4. METRNL expands the KIT-expressing endothelial cell population after myocardial infarction.

(A) t-SNE plots depicting all cardiac endothelial cell (EC) populations and Kit-expressing cardiac ECs (colored in blue) 3 days after sham or myocardial infarction (MI) surgery in wild-type mice. Cluster #5 comprised a high number of Kit-expressing ECs (arrowheads). (B) c-kitH2B-tdTomato/+ mice underwent sham or MI surgery and were treated with Fc fragment or KIT-extracellular domain-Fc fragment fusion protein (KIT-ECD-Fc, 100μg into the left ventricular cavity each). Fluorescent images and summary data depicting c-kitH2B-tdTomato/+-positive (arrow-heads) and c-kitH2B-tdTomato/+-negative CD31+ ECs in the infarct border zone on day 6. Extracellular matrix and cardimyocyte (CM) borders are highlighted by WGA staining. Scale bar, 100 μm. One-way ANOVA with Tukey test. (C) c-kitH2B-tdTomato/+-positive and c-kitH2B-tdTomato/+-negative CD31+ ECs in the infarct border zone in c-kitH2B-tdTomato/+ Metrnl+/+ (WT) and c-kitH2B-tdTomato/+ Metrnl−/− (Metrnl−/−) mice on day 6. (B and C) Summary data are means ± SEM. Two-way ANOVA with Tukey test. *P < 0.05, **P < 0.01, ***P < 0.001.
