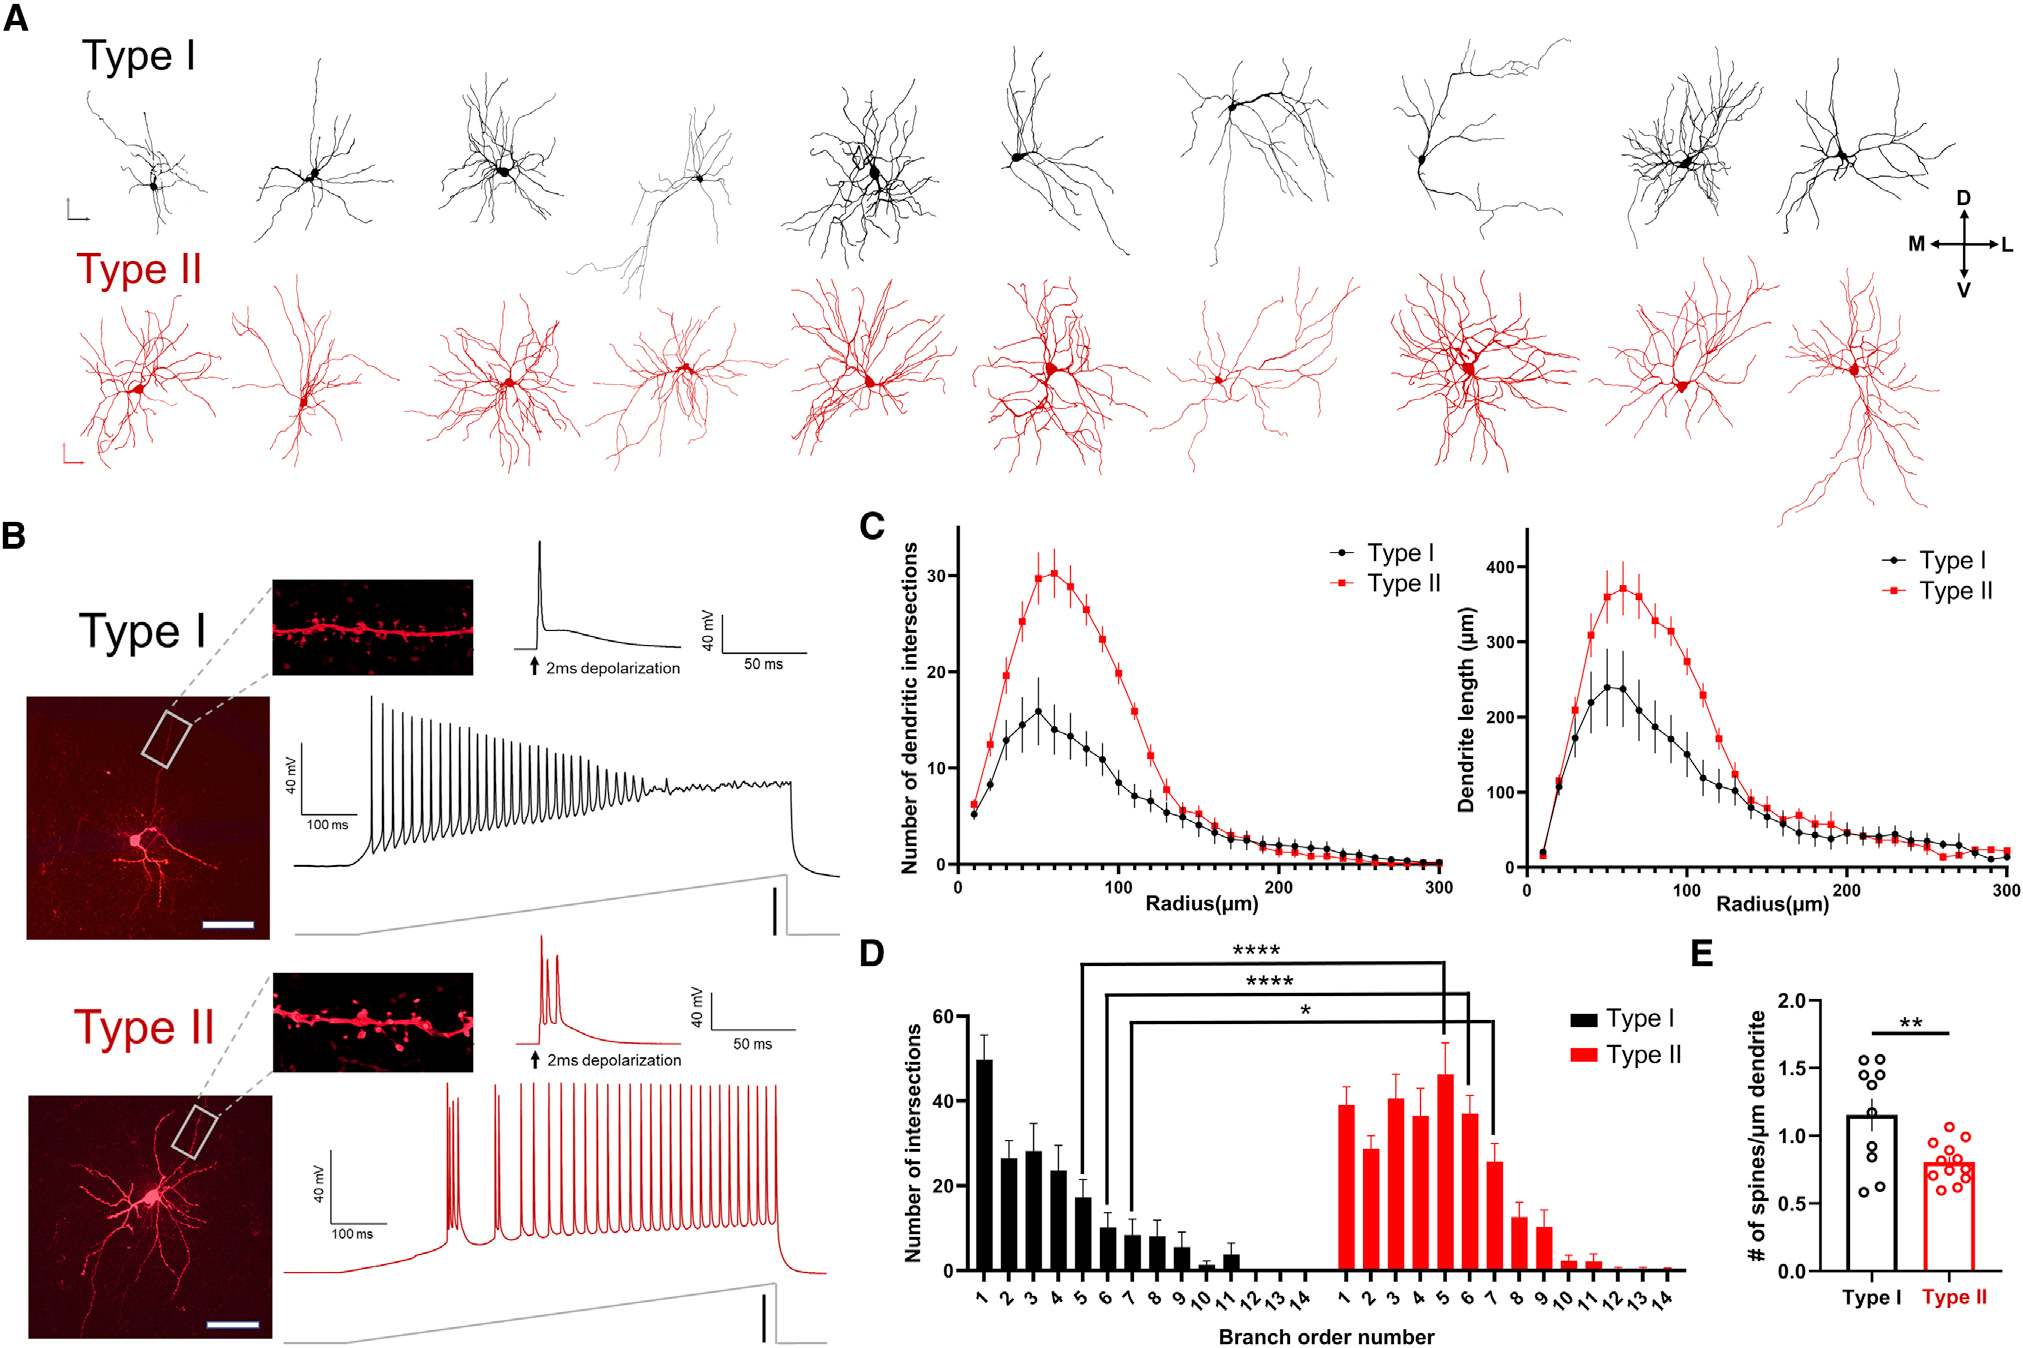
Figure 2. Claustrum type II spiny projection neurons dendritic morphology is more complex than that of type I neurons.

(A) Top: representative cell fill 3D reconstructions of type I claustrum projection neurons. Bottom: representative three-dimensional reconstructions of type II claustrum projection neurons (n = 10 cells shown for each subtype).
(B) Top: type I claustrum projection neurons were defined by a lack of burst firing following a 2 ms depolarization voltage step. Representative voltage trace following a current-injection ramp. Bottom: type II claustrum projection neurons were defined by the presence of burst firing following a 2 ms depolarization voltage step. Shown is a representative voltage trace following a current-injection ramp.
(C) Type II claustrum neurons displayed a greater number of dendritic intersections and increased dendrite length compared with type I neurons (Kruskal-Wallis test: p < 0.0001; type I: n = 11 cells; type II: n = 12 cells).
(D) Type II neurons displayed an increased number of intersections of higher branch order numbers (two-way ANOVA: F(13,308) = 3.97, p < 0.0001, Bonferroni post hoc: p < 0.01).
(E) Type I neurons displayed an increased number of spines per μm of dendrite (unpaired t test, p = 0.008).
Vertical scale bars: (A) 100 μm; (B) current ramp: 200 pA. Horizontal scale bars: (A) 100 μm and (B) 200 μm.
