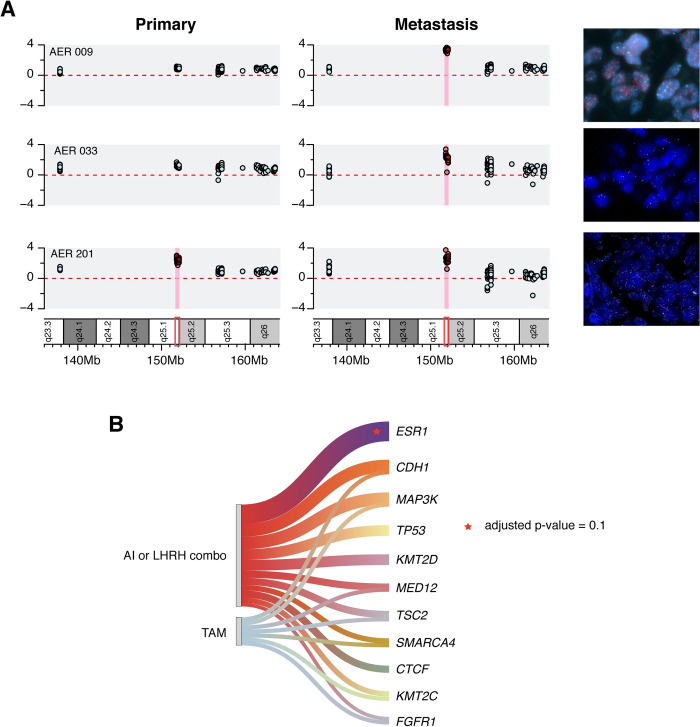
Fig 2. ESR1 enrichment in metastatic HR+ HER2- BC samples.
A) ESR1 gene sCNV in three representative cases. Each row represents a case, and each box indicates the log-ratio levels for matched primary and metastatic tumor specimens. Red square shows the exact ESR1 region. The red background highlights the amplification of the ESR1 gene. FISH-based validation of each ESR1 amplification is also shown (right panel). B) Recurrent genomic alterations in metastatic tumor specimens, and their association with different types of endocrine therapy (ET). ET is classified according to specific clinically relevant groups. Statistically significant associations are shown as stars (adjusted p-value = 0.1).

