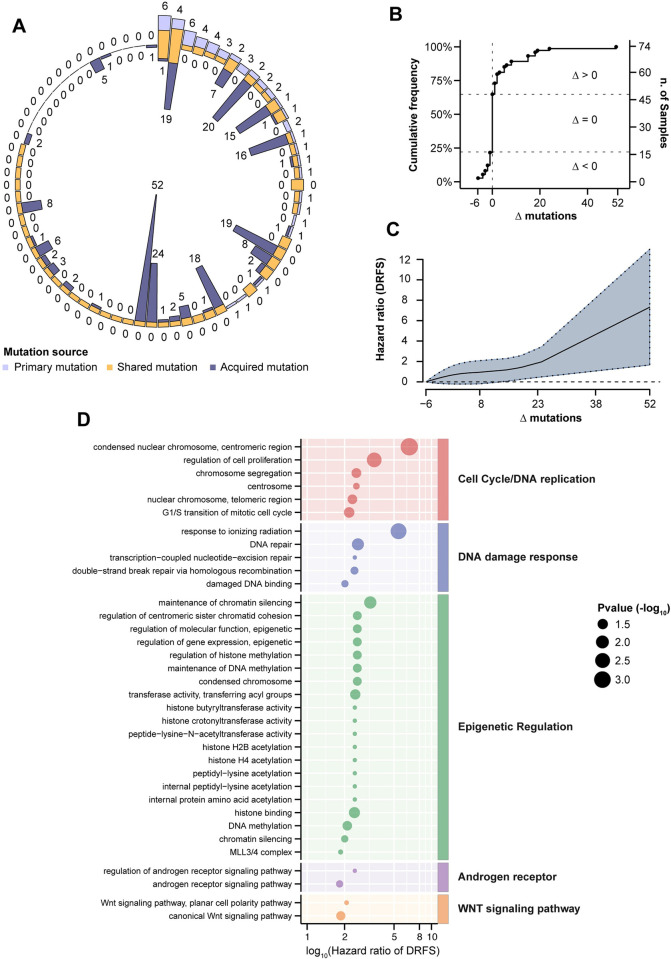
Fig 4. Genomic spectrum of acquired driver alterations.
A) The circle graph represents for each case (n = 74) the proportion of driver mutations detected in primary and/or metastatic tumor samples. Outer numbers represent mutations of eBC, inner numbers represent mutations of mBC. B) Cumulative frequency of the difference (Δ) between number of mutations in metastatic vs. primary tumor samples (Δ < 0, number of driver mutations in the primary tumor greater than in the corresponding metastatic sample; Δ = 0, equal number of driver mutations in primary vs. metastatic tumor; Δ > 0, number of driver mutations in the primary sample lower than in the metastatic sample. C) Non-linear relationship between the difference of driver mutations in metastasis/primary pair (Δ, x-axis), and DRFS hazard ratio of Schoenfeld residuals (y-axis). The analysis is adjusted for T/N status, Ki67, menopausal status and tumor grade. The solid line represents a penalized spline fit of the predicting variables, while the dashed lines show 95% confidence intervals. D) Functional analysis of Gene Ontology (GO) terms associated to cell cycle, DDR, epigenetic regulation, androgen receptor activity and WNT signaling pathway. The size of the dots is inversely proportional to the p values of estimated hazard ratio (x-axis) displayed in log10 scale. P values are reported in S5 Table.

