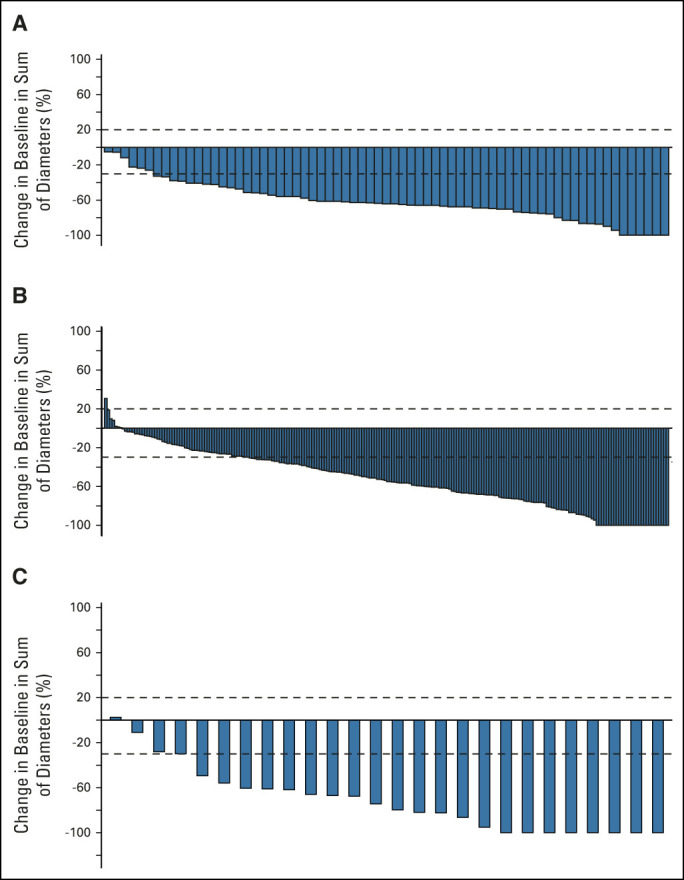
FIG 1.

Response to selpercatinib. The waterfall plots of maximum change in tumor size are shown in (A) for the 69 patients who were treatment-naive and (B) for 226 with prior platinum chemotherapy and (C) the change in intracranial tumor size for the 26 patients with measurable CNS disease at baseline. Vertical bars represent the best percent change from baseline in the sum of diameters for all target lesions. Progressive disease (+20%) and partial response (–30%) are indicated with the dashed lines.
