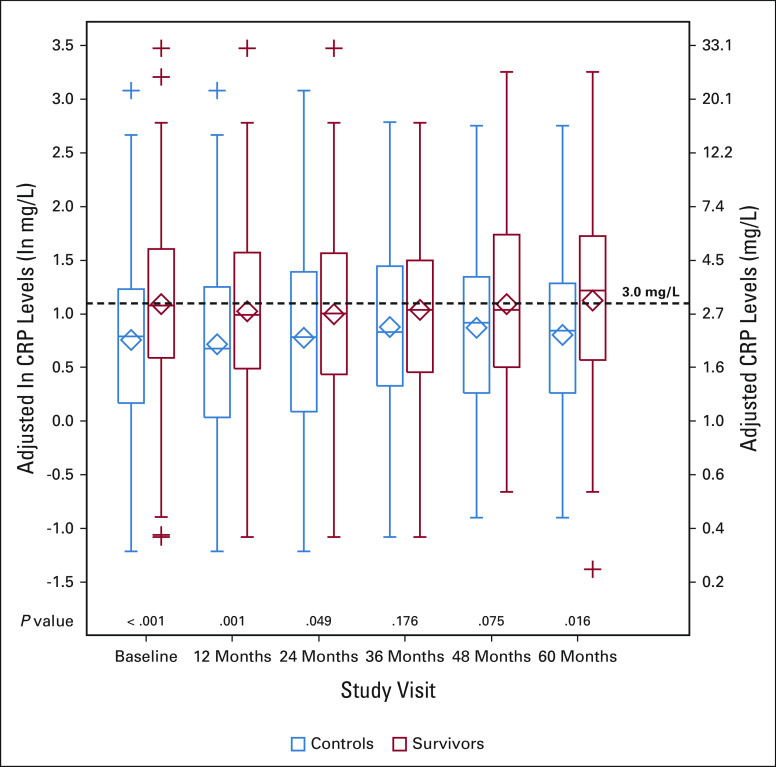
FIG 2.
Adjusted CRP levels by study visit for older breast cancer survivors and noncancer controls. Results of mixed model analyses in survivors (red, n = 380 total) and noncancer controls (blue, n = 318 total) at each study visit (baseline and 12, 24, 36, 48, and 60 months) using natural log-transformed CRP data (ln-CRP, left axis), adjusted for age, race (White v Others), cognitive reserve (WRAT4 Word Reading score), study site, obesity (≥ 30 v < 30 kg/m2), and comorbidities (> 2 v ≤ 2). The results for adjusted ln-CRP values were also back-transformed to mg/L (right axis), and a horizontal dotted line at 3 mg/L (considered high CRP) has been added for ease of interpretation. The boxes indicate the interquartile range (ie, 25th-75th percentiles) of adjusted ln-CRP values, the whiskers above and below the boxes indicate the 5th and 95th percentiles, and + signs indicate values below the fifth or above the 95th percentile. Diamonds represent the mean CRP values; heavy lines inside the box are the median. P values from the mixed models for survivor versus control differences in adjusted ln-CRP at each study visit are shown along the x axis. See the Data Supplement for detailed data at each study visit. CRP, C-reactive protein; WRAT4, Wide Range Achievement Test.

