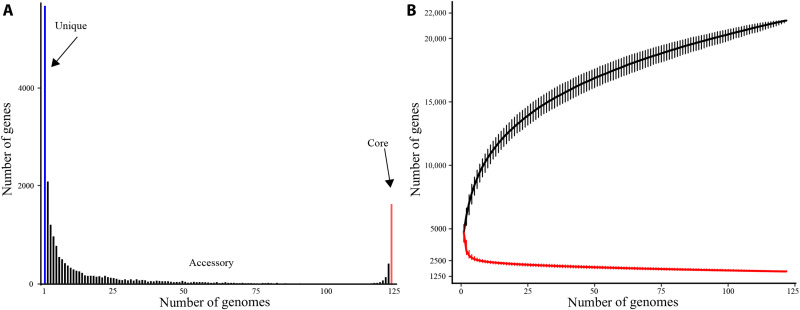
Fig. 1. Pangenome analysis of 122 Microcystis.
(A) The frequencies of pan-genes (y axis) are plotted as a function of the number of genomes sharing those genes (x axis). Blue indicates unique genes, black indicates accessory genes, and orange indicates core genes. (B) Rarefaction curves created with PEPPAN for the accumulations of pan genes and core genes of 122 Microcystis genomes from 1000 random permutations. The gene accumulation curve of the increasing number of genomes fitted the power law (n = κNα) with exponent α ± 95% confidence interval (CI) = 0.847 ± 0.003; core genes decreased as the number of genomes increases and followed a power law (n = κNα) with exponent α ± 95% CI = −0.172 ± 0.008. Error bars indicate 95% CIs for 1000 random permutations.

